
Background
Nginx is one of the most widely used web server that can also be used as a reverse proxy, load balancer, mail proxy and HTTP cache. By default Nginx writes logs to /var/log/nginx/access.log in a plain text format like this:
157.245.235.57 - [04/Aug/2020:21:16:03 +0000] "POST /api/ HTTP/1.1" 200 457 13 "-" "Vector/0.10.0 (g0f0311a x86_64-unknown-linux-gnu 2020-07-22)" 0.002 0.000 25f146d2aaee0d50f35c4404c9bb1f12
114.227.157.172 - [04/Aug/2020:21:16:11 +0000] "GET /phpmyadmin/ HTTP/1.1" 404 199 580 "-" "Mozilla/5.0 (Windows NT 10.0; WOW64) AppleWebKit/537.36 (KHTML, like Gecko) Chrome/51.0.2704.103 Safari/537.36" 0.000 - eb3c6c45f70e9bf7e562956c00a42970
195.54.160.21 - [04/Aug/2020:20:31:07 +0000] "GET /vendor/phpunit/phpunit/src/Util/PHP/eval-stdin.php HTTP/1.1" 404 284 209 "-" "Mozilla/5.0 (Windows NT 10.0; Win64; x64) AppleWebKit/537.36 (KHTML, like Gecko) Chrome/78.0.3904.108 Safari/537.36" 0.181 - 7455ea5f3bc5512ab544b068600041bc
Nginx logs contain information like request latency, request IP and etc that are very useful for monitoring system health. But they will be even more useful if they can be in a more structured format. In order to convert logs into useful stats, we will need a log pipeline to process log data, transform them into structured data which can be easily aggregated, and then route them to analytics tools.
In this blog I'll walk through the steps I went through to build a log pipeline to process my Nginx logs and how we can gain insights from structured log events.
Set Up Log Pipeline
We will walk through how to create a log pipeline using SignalFlex.
SignalFlex is a hosted event processing pipeline. It can receives any arbitrary log data from HTTP endpoints. And It allows us to configure transform and processing logic without writing code. After data is received, SignalFlex transform them into structured events and forward them to log management and monitoring tools (Datadog, Elasticsearch etc). We will use SignalFlex to create a log pipeline to process our Nginx logs and send structured data to Honeycomb.

- Transform Log Event
Nginx logs are raw text and have no structure:
157.245.235.57 - [04/Aug/2020:21:16:03 +0000] "POST /api/ HTTP/1.1" 200 457 13 "-" "Vector/0.10.0 (g0f0311a x86_64-unknown-linux-gnu 2020-07-22)" 0.002 0.000 25f146d2aaee0d50f35c4404c9bb1f12
We will need parse them into some structured data like following:
{
    "ip_address": "157.245.235.57",
    "status": "400",
    "path": "POST /api/ HTTP/1.1"
    ...
}
First step is to use regex parsing to extract these value pairs out of raw log. We will use a regex pattern:
^(?P<ip>[\w\.]+) - \[(?P<time>.*)\] "(?P<method>[\w]+) (?P<path>.*) (?P<scheme>.*)/(?P<http_version>.*)" (?P<status>[\d]+) (?P<request_length>[\d]+) (?P<bytes_out>[\d]+) "(?P<referer>.*)" "(?P<agent>.*)" (?P<request_time>.*) (?P<upstream_response_time>.*) (?P<request_id>.*)$
This Regex pattern will extract key value pair out of each log line. We will use this Regex pattern to configure a SignalFlex Regex transform:

SignalFlex makes it easy to define transform logic. You can test transform with example log data.
After Regex parser transformation, an Nginx log event will be a structured JSON like following:
{
    "_message": "157.245.235.57 - [04/Aug/2020:21:22:00 +0000] \"POST /api/ HTTP/1.1\" 200 457 13 \"-\" \"Vector/0.10.0 (g0f0311a x86_64-unknown-linux-gnu 2020-07-22)\" 0.002 0.000 d88709e784d32b83783838ce67cefd16",
    "agent": "Vector/0.10.0 (g0f0311a x86_64-unknown-linux-gnu 2020-07-22)",
    "bytes_out": "13",
    "http_version": "1.1",
    "ip": "157.245.235.57",
    "method": "POST",
    "path": "/api/",
    "referer": "-",
    "request_id": "d88709e784d32b83783838ce67cefd16",
    "request_length": "457",
    "request_time": "0.002",
    "scheme": "HTTP",
    "status": "200",
    "time": "04/Aug/2020:21:22:00 +0000",
    "upstream_response_time": "0.000"
  }
We will notice that values of request_length, request_time and upstream_response_time are string, we need to convert them to number so that they can be aggregated. We can add a SignalFlex JavaScript transform to convert these values to numbers.

After applying Regex and JS transform, our log event will look like following, with values of request_length, request_time and upstream_response_time converted to numbers
{
    "_message": "157.245.235.57 - [04/Aug/2020:21:22:00 +0000] \"POST /api/ HTTP/1.1\" 200 457 13 \"-\" \"Vector/0.10.0 (g0f0311a x86_64-unknown-linux-gnu 2020-07-22)\" 0.002 0.000 d88709e784d32b83783838ce67cefd16",
    "agent": "Vector/0.10.0 (g0f0311a x86_64-unknown-linux-gnu 2020-07-22)",
    "bytes_out": "13",
    "http_version": "1.1",
    "ip": "157.245.235.57",
    "method": "POST",
    "path": "/api/",
    "referer": "-",
    "request_id": "d88709e784d32b83783838ce67cefd16",
    "request_length": 457,
    "request_time": 0.002,
    "scheme": "HTTP",
    "status": "200",
    "time": "04/Aug/2020:21:22:00 +0000",
    "upstream_response_time": 0.000
  }
- Route Data to Honeycomb
We now have structured log events, we can send them to Honeycomb where we will aggregate these events and monitor our Nginx service.
We can configure our Honeycomb dataset and API key on SignalFlex.

- Send Data To Pipeline
Now that the log pipeline is ready on SignalFlex, we can start sending logs to it.
To collect Nginx logs (/var/log/nginx/access.log) and send to SignalFlex, we can use a lightweight log shipper called Vector. It will scan Nginx log file and send logs to our SignalFlex pipeline.
- Install Vector.
$curl --proto '=https' --tlsv1.2 -sSf [https://sh.vector.dev](https://sh.vector.dev/) | sh
- Create a Vector configuration file
/etc/vector/nginx.toml
data_dir = "/var/lib/vector"

[sources.in]
  type = "file"
  include = ["/var/log/nginx/access.log"]

# Output data
[sinks.signalflex]
  inputs   = ["in"]
  type     = "http"
  encoding.codec = "text"
  headers.pipeline = "${pipeline_id}"
  headers.api_key = "${api_key}"
  uri = "https://alpha.signalflex.io/api/"

  request.timeout_secs = 1000
We will replace pipeline_id and api_key with real values that can be found in SignalFlex settings
- Start Vector
$vector —config /etc/vector/nginx.toml
We can verify log data are flowing into SignalFlex by looking at pipeline dashboards

Aggregate Request Time
Once data arrive in Honeycomb, we can use a wide range of aggregation methods to deep dive into server health.
View Nginx's average request latency

View distribution of request latency
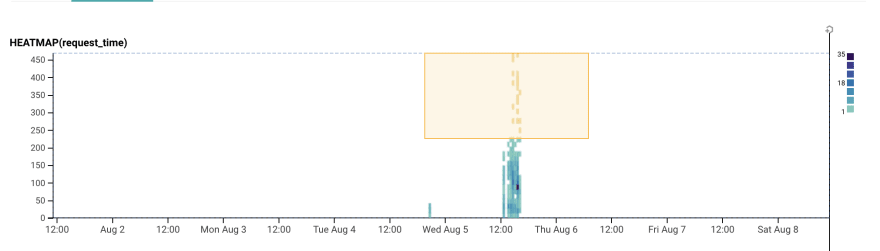
As we can see, requests inside yellow rectangle are outlier requests that have higher latency than rest of the requests. We can use Honeycomb's Bubble Up feature to find possible reason that causes high latency.Bubble Up on request latency and request length
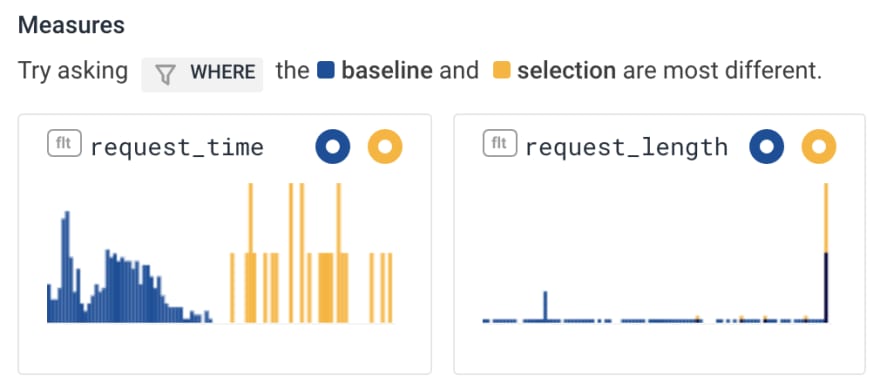
Bubble up result shows that outlier requests that have high latency also have bigger request length. So it is obvious that big request length cause high request latency.
Conclusion
In this post we have walked through how to use SignalFlex as log pipeline to process Nginx logs and send data to Honeycomb where we can analyze and monitor system status.
SignalFlex removes your burden of managing and scaling your own log pipeline. And it allows you to define complex transform logic for you event stream and supports sending data to various log and metrics tools. If this interests you, join the waitlist!

Top comments (0)