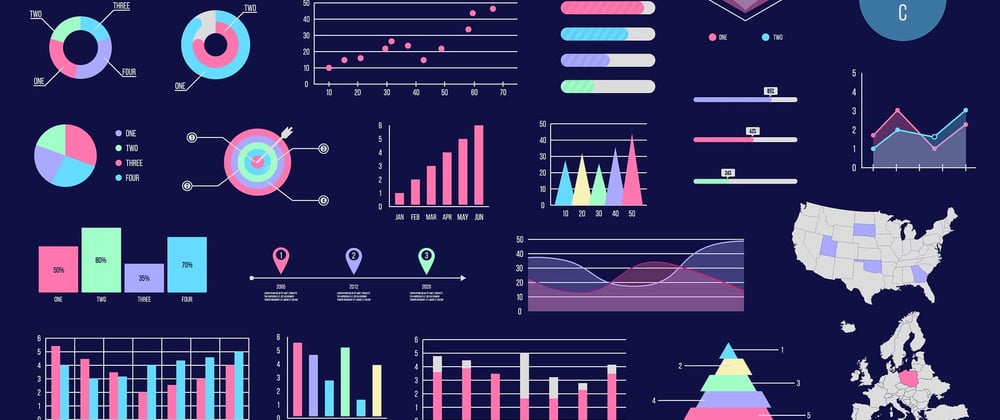
Data visualization is the graphical representation of data. But why should data analysts care about data visualization? Well for the audience won’t always have the ability to interpret or understand the complex information that we relay to them so our job is to inform them about our analysis in a way that it is very simple, meaningful, engaging, and easy to understand for a common man. Part of why data visualization is so effective is because people’s eyes are drawn to, have attention to colors, shapes, and patterns, which makes those visual elements perfect for telling a story that goes beyond just the numbers or the data.
To understand the data visualization, one of the best ways to do it is exploring many examples of it in a proper fashion as well as having a hands on experience over various types of problems is one of the best way to understand it. Data analysts role is to completely understand the data driven problem and give his/her valuable insights to solve that problem in a proper manner.
Here are some of the rich resources to understand about the data visualization.
Data Visualization Catalogue:

This catalogue have numerous types of charts, graphs and diagrams which any one can explore, understand and get knowledge about particular charts, diagrams etc. This catalogue helps one to understand which charts or particularly which right visualization to use during his/her analysis which depicts his/her insights, understandings, findings in a very simple and meaningful fashion.
This is a very resourceful website or precisely blog, for the beginner data analysts, after finding a proper visualization for your data driven problem we need to find out how to tell our findings, insights very effectively in through our visualization. It particularly gives a proper understandings to the visualizations.
Easily access a wide variety of data. Data Studio’s built-in and partner connectors makes it possible to connect to virtually any kind of data.
Turn your data into compelling stories of data visualization art. Quickly build interactive reports and dashboards with Data Studio’s web based reporting tools.
This website is dedicated to helping you make clearer, more informed visual decisions based on facts and data. These projects are made by students, designers, and even data analysts to help you gain insight into how they have taken their own data and turned it into visual storytelling.
I hope you really enjoyed reading this blog and I truly feels it might be very useful for you to understand about the art, the beauty of data visualization. If it somehow helped you anyways please give a thumbs up in the comment section, if you want to share something please feel free to do so.


Top comments (0)