
Originally written by Maksymilian Jaworski and Lidia Kurasińska
You’ve probably heard that creating ETL (extract, transform, load) pipelines, especially complex ones, is a complicated task. Various tools have been developed to make this process much easier, but most of them still require some knowledge of a programming language (for example, Python or R) often combined with an understanding of tools such as Spark.
In August 2017, AWS created Glue DataBrew, a tool perfect for data and business analysts, since it facilitates data preparation and profiling. A year ago, the company released AWS Glue Studio, a visual tool to create, run, and monitor Glue ETL Jobs.
AWS Glue Studio supports various types of data sources, such as S3, Glue Data Catalog, Amazon Redshift, RDS, MySQL, PostgreSQL, or even streaming services, including Kinesis and Kafka. Out of the box, it offers many transformations, for instance ApplyMapping, SelectFields, DropFields, Filter, FillMissingValues, SparkSQL, among many. We can save the results of our jobs to Amazon S3 and tables defined in the AWS Glue Data Catalog.
Also, apparently, we can use it all without knowing Spark, as Glue Studio will generate Apache Spark code for us.
So, let’s see in practice what we can do with AWS Glue Studio. I promised myself that I would try not to write a single line of code when solving my case.
In this article, I used a slightly modified E-Commerce Data dataset.
AWS Glue Studio in practice
Let’s assume that you received the following task from your data analysts:
One system is uploading daily CSV files, which contain the following information: invoice_no, stock_code, description, quantity, unit_price, customer_id, country, invoice_date. Calculate the total number of sold items (count quantity) and the total purchase value (sum per item quantity multiplied by unit_price) per customer and day. Save the results in a CSV file separated by commas in an S3 bucket.
I know this sounds more like a job for a data analyst and some of you probably think this is a simple and boring task, but don’t worry, we will add some action later on.
My input files are located in this directory: aws-glue-demo-202109/inputs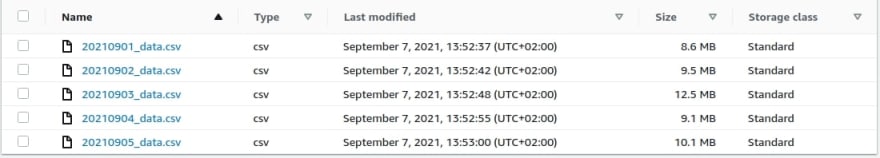 Okay, let’s see how we can do this with AWS Glue Studio.
To access it, choose AWS Glue from the main AWS Management Console, then from the left panel (under ETL) click on AWS Glue Studio. Go to Jobs, and at the top you should see the Create job panel—it allows you to create new jobs in a few different ways: Visual with a source and target, Visual with a blank canvas, Spark script editor, and Python Shell script editor.
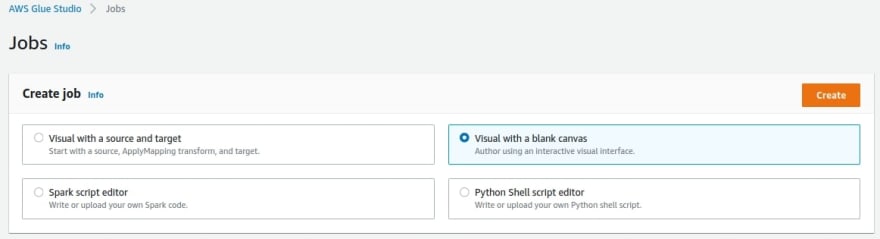 I selected Visual with a blank canvas. It should create a new, empty, untitled job.
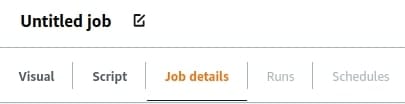
Before we start building our ETL process, let’s go to the Job Details tab and discuss some important properties that determine how AWS Glue will run the job. Except for the job’s name, you can change those settings any time you want.
- Glue version—it determines the versions of Apache Spark and Python that are available to the job. Note: some features might not be available for particular versions. For instance, at the time of writing, the Data Preview function is not working with 3.0, the latest version.
- Language—either Python or Scala. I will go with Python.
- Worker type (G.1X or G.2X)—for the G.1X worker type, each worker maps to 1 DPU. For the G.2X, it’s 2 DPU for each worker. I chose G.1X as it has way more resources than I will actually need.
- Job bookmark (Enable, Disable, Pause)—now this is a pretty important variable, especially that Enable is a default value. In a nutshell: when you enable job bookmarks, once you process some data (e.g., an S3 file), the data is marked by a job as processed and will not be processed by this job in the next executions. Bookmarks are tied to jobs, so different jobs can process the same file. I’m disabling it now, as I will probably have to process the same files over and over again during the development of my job. For extended description of Job Bookmarks, please read Tracking Processed Data Using Job Bookmarks.
- Number of retries—this is pretty self-explanatory. I switch this value from 3 to 0 right now, as I don’t want Glue to retry executing a task which fails just because I made some dummy mistake, like using an empty file, for example.
I’m not going into the Advanced properties section, but keep in mind that this is where you can configure your S3 script path, Spark UI logs path, set maximum concurrency, disable metrics, etc.
Note: you have to set those settings for each created job, unless you’re cloning a job—then its copy has the same settings as the original one.
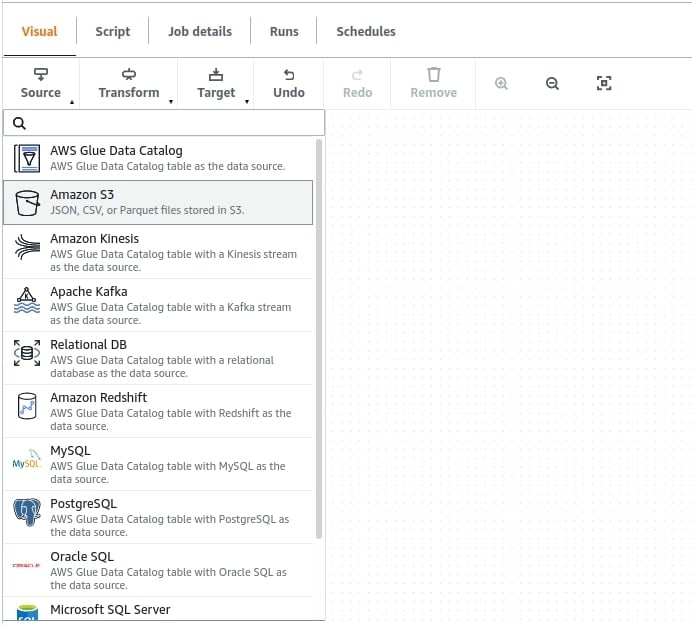
Now, let’s go back to the Visual section.
1.From Source, select the Amazon S3 node.
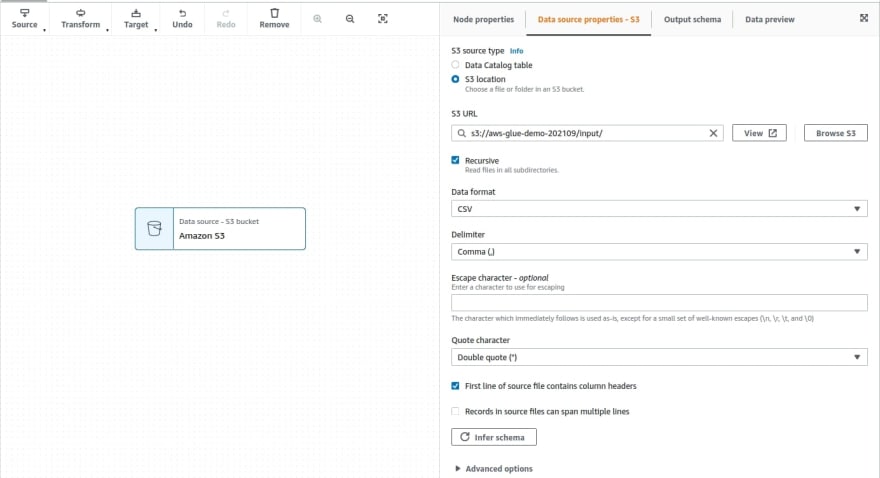
 In Data source properties - S3 set:
- S3 source type: S3 location—so you will access S3 files directly
- S3 url: s3://aws-glue-demo-202109/input/
- Recursive: true
- Data format: CSV
- Delimiter: Comma (,)
Note: you are limited to the following delimiters: Comma, Ctrl+A, Pipe, Semicolon, Tab.
 Now, let’s go to the Output schema tab.
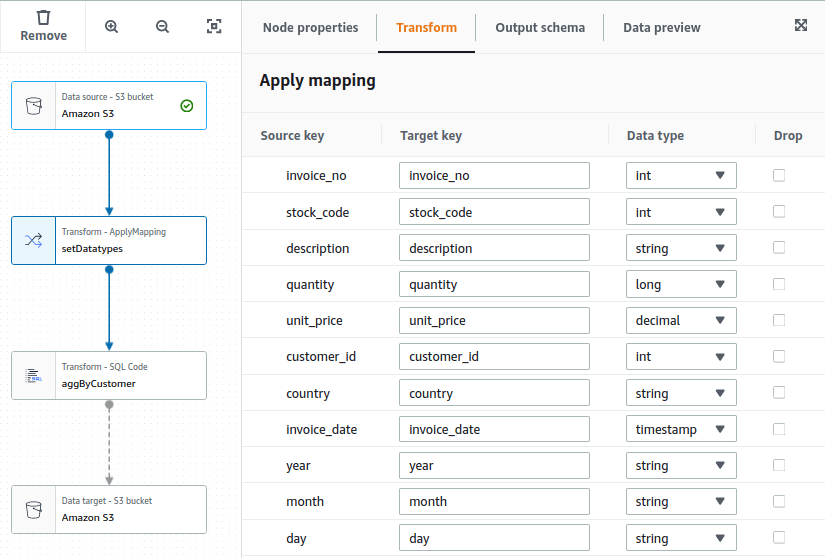
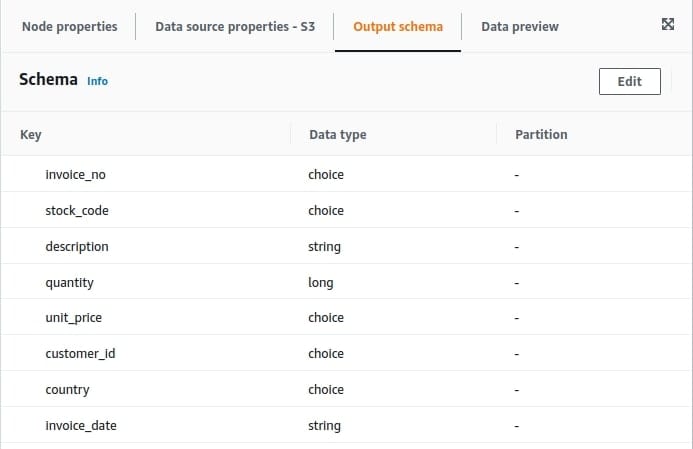 Well, those datatypes don’t look right—you will have to change this. Click the Edit button and for each key set the right data type (according to the information provided by data analysts):
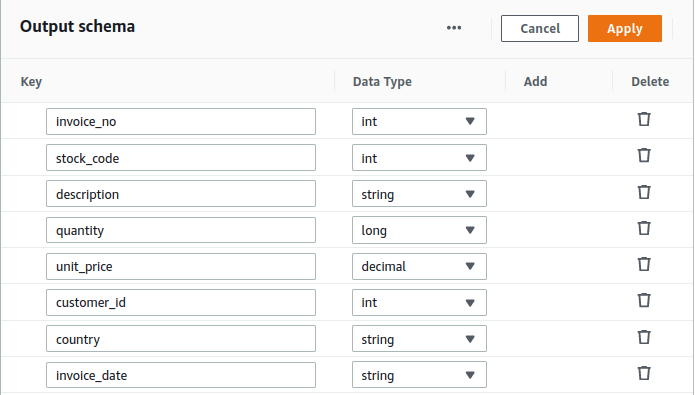 It looks good, click on Next and go to the next step.
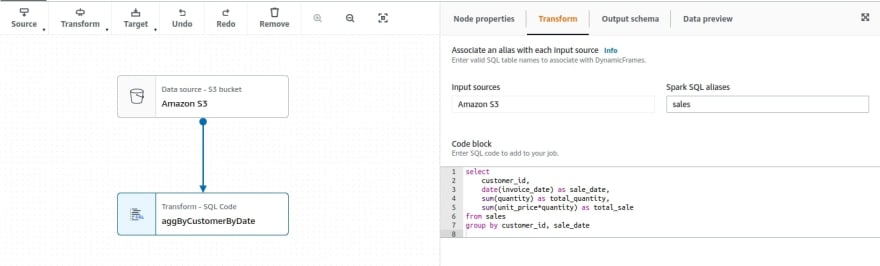
2.Doing aggregations. Here lies the first “obstacle,” as Glue Studio does not have a built-in transformation node which allows us to do aggregates. The best solution is to use Transform - Spark SQL node. You can name the node aggByCustomerByDate, and in the transform section, select Amazon S3 (the name of the parent node) as input source and give it a sales alias, which you can use in your SQL code as the table name. In the Code block, you can put a simple SQL query, which takes the customer_id column, gets the date from the invoice_date column, sums quantity and quantity*unit_price, and groups it by customer and sale_date.
Let’s assume that it doesn’t break my “not-writing-a-line-of-code” rule.
Note: this editor does not verify syntax, so double-check your query before you run it.
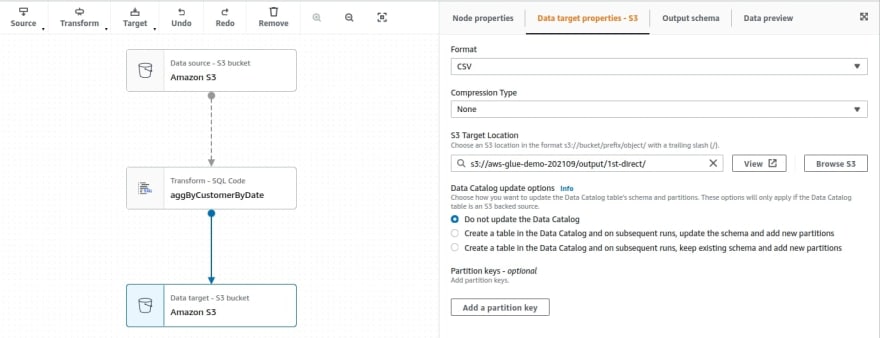
 3.Now that you are done with aggregates, save its result to S3. From the Target menu, choose Amazon S3, pick up CSV Format. Decide if you want to apply any compression and set the target location to s3://aws-glue-demo-202109/output/1st-direct
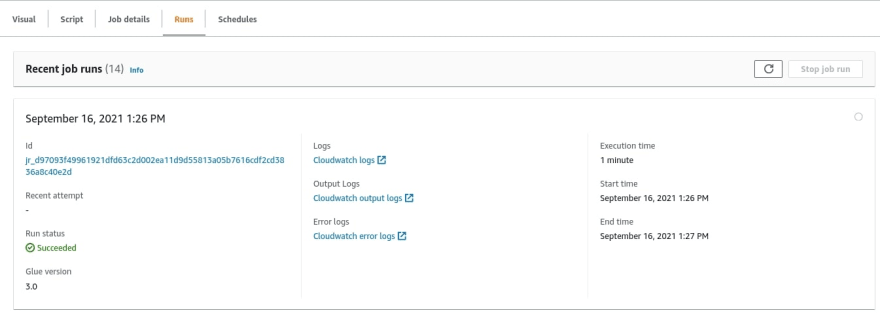
 4.The job is ready. In the right-upper corner, hit Save, then Run, and wait. You can go into the Runs tab and see the job progress, as well as links to logs and run metadata.
After a minute, you can see that the job has succeeded.
 Now, go to the target S3 directory. You have 4 files here:
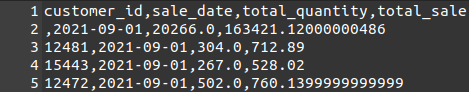
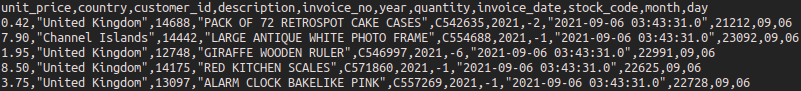
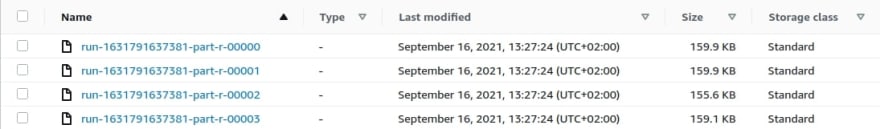 Each file contains customer_id, sale_date, total_quantity and total_sale.
 Okay, that was quite quick and simple. But I’m not satisfied with this solution, and you might not be, either. True, I did calculations for all files, but what will happen tomorrow when the new file arrives? Like you, I don’t want to process all the data once again. We’re only interested in processing newly created files.
Besides, data analysts also have some further requests.
They remembered that sometimes quantity might be a negative value which indicates that an item was returned. They would like me to exclude those rows from the aggregations and store the list of returned items in a separate file.
If you took a good look at the last image, you should notice that the second row is missing a value for customer_id. Analysts would like to get rid of empty customers.
Analysts would like to link some customers’ data (first name, last name, address) to the file with aggregations.
Working on four separate files is a bit troubling—they would prefer to have one file only.
Let’s address my issue first. The way I see it, there are two possible approaches:
The aforementioned Job Bookmarks. As the doc says: “Job bookmarks are used to track the source data that has already been processed, preventing the reprocessing of old data. Job bookmarks can be used with JDBC data sources and some Amazon Simple Storage Service (Amazon S3) sources. Job bookmarks are tied to jobs. If you delete a job, then its job bookmark is also deleted. You can rewind your job bookmarks for your Glue Spark ETL jobs to any previous job run, which allows your job to reprocess the data. If you want to reprocess all the data using the same job, you can reset the job bookmark.”
Manually, or by using a function or some parameter, decide which files (day or range of days) should be processed.
The first solution seems really cool, but let’s say that I’m not 100% sure how the data is loaded—perhaps files are overwritten every day? Or they could suddenly start doing that? Or you’re going to modify our jobs often and re-run them for particular files, and you don’t want to remember about resetting the job bookmark?
Either way, let’s say that for the sake of this article, you simply can’t or don’t want to rely on job bookmarks. What can you do now?
You could filter out the data in, for instance, Transform - Spark SQL node, but it doesn’t really solve the issue—the job will still be processing all files, you will just filter out the output or the data which goes into aggregations. You have to figure out how to divide those files “logically.”
Instead of working directly with S3 files, try to organize S3 files into databases and tables. Perhaps then you will be able to query the data more efficiently. Use the AWS Glue Crawler for this.
In a nutshell, AWS Glue can combine S3 files into tables that can be partitioned based on their paths. For example, if your files are organized as follows:
bucket1/year/month/day/file.csv
then AWS Glue can create one table from all files in bucket1, which will be partitioned by year, month, and day. The level of partition creation is also definable, and you can have, for example, a table for each separate day, month or year. You’ll find more details in this article on working with partitioned data in AWS Glue.
For now, there are two ideas for you to test:
Create a separate table for each day.
Create one table with partitions by year, month, and day.
But before you create databases and tables, you have to reorganize the structure of your S3 bucket from:
bucket/YYYYMMDD_data.csv
to
bucket/year/month/day/data
So, instead of:
aws-glue-demo-2021/inputs/20210901_data.csv
aws-glue-demo-2021/inputs/20210902_data.csv
aws-glue-demo-2021/inputs/20210903_data.csv
aws-glue-demo-2021/inputs/20210904_data.csv
aws-glue-demo-2021/inputs/20210905_data.csv
your files will be organized this way:
aws-glue-demo-2021/inputs/2021/09/01/data.csv
aws-glue-demo-2021/inputs/2021/09/02/data.csv
aws-glue-demo-2021/inputs/2021/09/03/data.csv
aws-glue-demo-2021/inputs/2021/09/04/data.csv
aws-glue-demo-2021/inputs/2021/09/05/data.csv
Once it’s done, you can start working with AWS Glue Crawler (which is also available from the AWS Glue Studio panel in the Glue Console tab.)
 First, configure a crawler which will create a single table out of all the files.
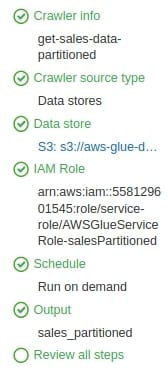
Click on Add Crawler, then:
- Name the Crawler get-sales-data-partitioned, and click Next.
- Keep the Crawler source type on default settings (Crawler source type: Data stores & Crawl all folders), then click Next again.
- Select S3 as the datastore and specify the path of s3://aws-glue-demo-202109/inputs and click Next.
- No, you don’t want to add another data store.
- Now, you can either choose an existing role or create a new one. Go ahead and create a new one.
- For now, choose Frequency: Run on demand.
- To store the Crawler output, create a database called sales_partitioned and select the created database from the drop-down menu. In configuration options, select Ignore the change and don’t update the table in the data catalog and Delete tables and partitions from the data catalog (I will explain why later on), and click Next.
- Review your crawler and confirm.
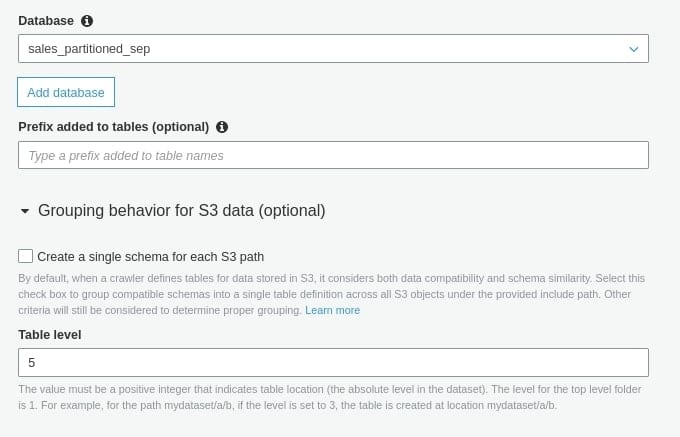
 For the crawler that will create separate tables the process is pretty much the same; the only changes are in following steps:
 - Step #1: Name it get-sales-data-partitioned-sep.
- Step #2: Choose an already existing role (created for the previous crawler.)
- Step #7: In Configure the crawler output, create a new database called sales_partitioned_sep. In Group behavior for S3 - Table level, enter 5. Why 5? Well, counting from the beginning: bucket is the first level, inputs—the second one, year—the third one, month—the fourth one, and day comes fifth.
 Next, review your crawler and save it. At this point, you should have two crawlers that will create two separate databases—run both and wait.
After a while, you can see that the get-sales-data-partitioned crawler created one table and get-sales-data-partitioned-sep created nine tables.
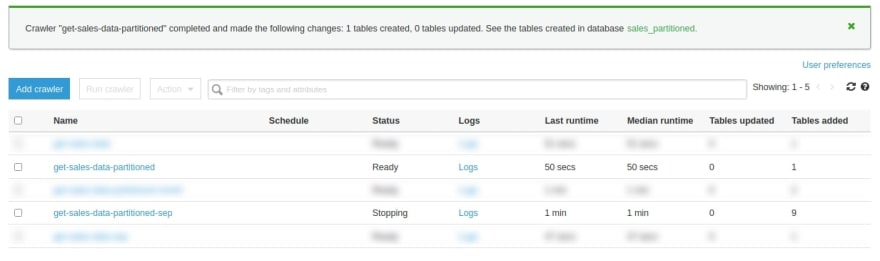 Why nine? Most likely because someone created new files in the meantime. You can find out by going into Databases, where you should see your databases:
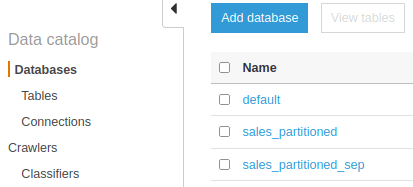 In sales_partitioned you should see one table:
 Whereas in sales_partitioned_sep, you should see nine tables.
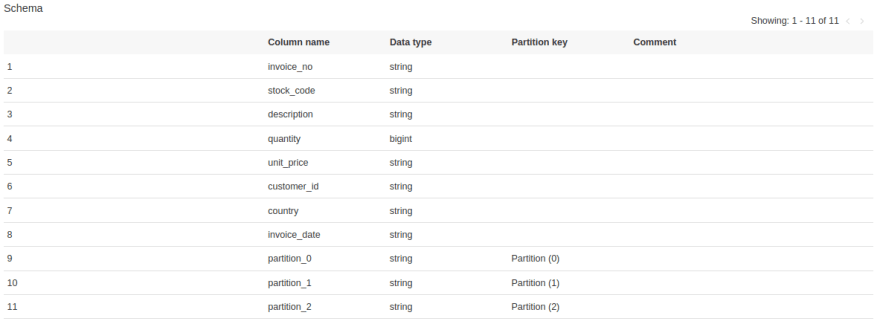 The first thing that stands out is that one of the tables repeated in two months got an ugly suffix. But let’s go to the input_partitioned table. At the bottom you should see columns, which are your partitions:
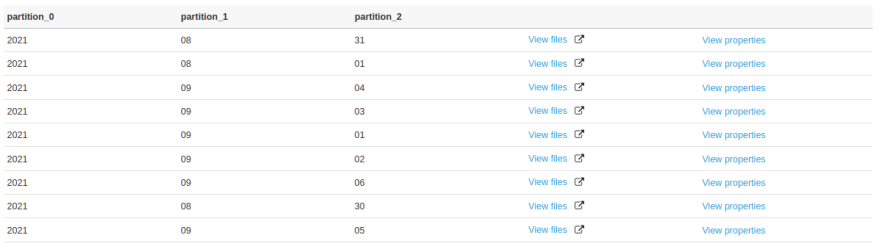
 How to figure out what’s behind partition_0, partition_1, and partition_2? Click on View Partitions: you can see that partition_0 is year, partition_1 is month, and partition_2 is day.
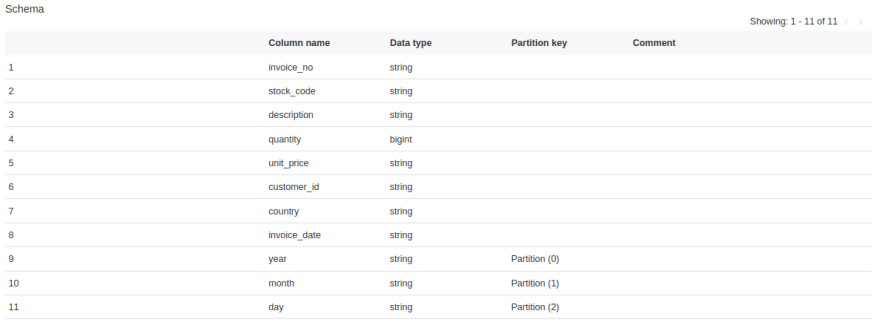
 Click on Close Partitions, next Edit Schema, and rename these columns. Save it, and now your table should look like this:
 Note: now it is important to explain why I previously checked Ignore the change and don’t update the table in the data catalog option during crawler creation. If I had not selected this option and run the crawler tomorrow, the column names I gave (year, month, day) would have been overwritten back to partition_0, partition_1, and partition_2.
Update! There is one thing that I missed while writing this article. If you name your S3 partitions the following way:
year=2021/month=08/day=30/data.csv
Glue Crawler will automatically pick up partition names, and you won't have to rename columns by yourself.
Now, back to your jobs—what are the options? On the left-hand side, you can see that I can select individual tables from the sales_partitioned_sep database. On the right-hand side, I have only one table to choose from, but I can send partition predicates.
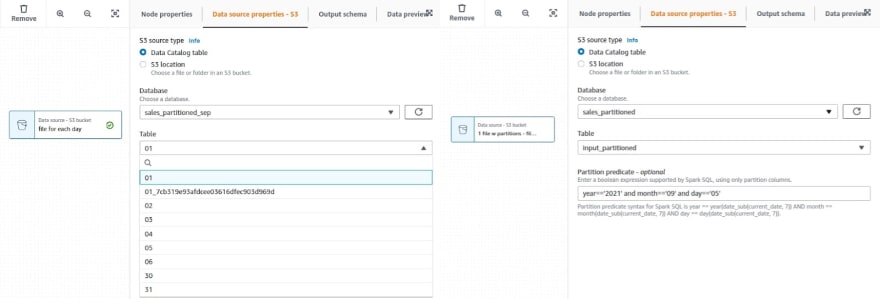 Both approaches reduce the amount of initial data. However, there are few things that I don’t like about the second one:
- the names of the tables do not clearly indicate (at least in my case) what data we are working on,
- when I have to work on more than one day, I will have to add separate source nodes and create joins, whereas in the first solution, I will only have to modify the query in predicament pushdown.
Okay, so I’m good with the first one but, before we proceed, here are a few notes.
Now that we are working with a Data Catalog table instead of S3 files directly, we should note that the output of the file has changed. We no longer have choice fields—now data types were defined by Glue Crawler.
So, how can you change this? There are three options:
- you can edit schema types in the Glue Data Catalog (same way we changed the partition name),
- you can change the types in the first step (like in the previous job),
- you can add a separate transformation node that will change the types.
I chose the third option. Why? Firstly, because I want everyone to see that this step is taking place (that we are expecting some data types.) Secondly, because I want to show you another transformation.
So, with partition predicate and extra step for applying data types, our job looks like this:
 Now, back to the analyst issues.
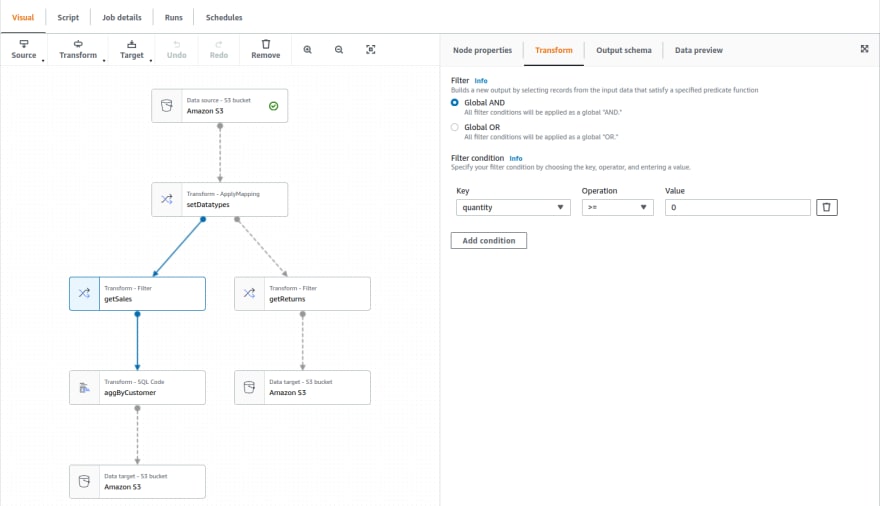
Firstly, let’s address item returns. You want to filter out rows with negative unit_price and save them in a separate file. Add two additional transforms - Filter nodes after setDatatypes node. The first one (getSales) takes records with unit_price >= 0; the second one (getReturns) takes records with unit_price < 0. After getSales, proceed with aggregations and then save it to S3; after getReturns, just save it to S3.
 Note: it seems that you cannot combine or and and operators in one step. If you really need to do it, you should use a Spark SQL node and write a custom SQL query.
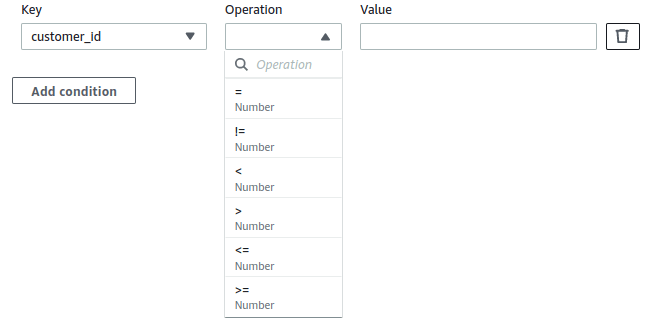
What’s next? Try to remove empty customers from the calculation. Now, this one is a bit tricky—you want to filter it out after you set data types using Transform - Filter node, but this step is limited to “=, !=, <, >, <=, >=” and using != with Null or empty string is not working...
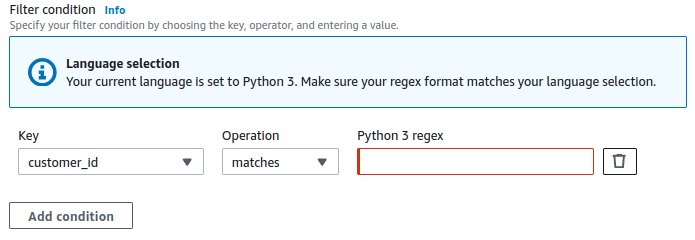
 So maybe you could filter out before you set data types? Well, you can’t do that—before applying data types you can only filter columns for matching values using regex.
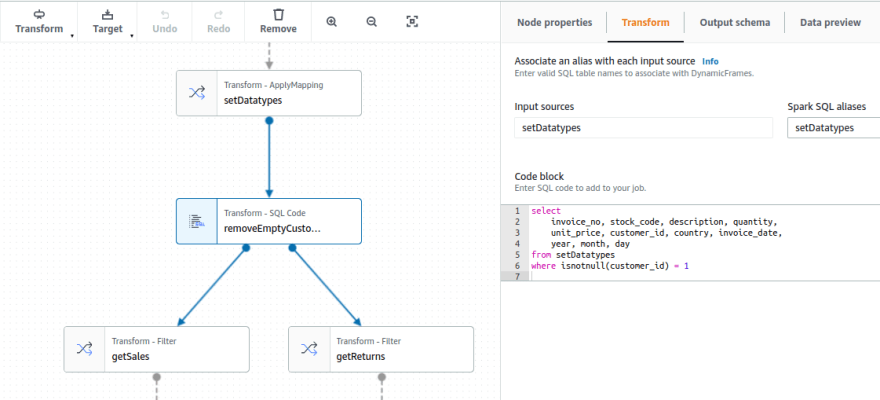
 So, what’s left? Once again, you have to use Spark SQL transformation to write a query which will filter out null values. The key function is isnotnull(column) = 1. I placed this step after applying data types and before filtering out discounts.
 Next, let’s handle the number of partitions of output files. And here I have to give up—it can’t be accomplished without using custom transformation (well, at least I didn’t figure out how to do that.) Is it tough?
Well, it depends. The documentation (AWS doc: transforms custom) is not very extensive and contains only one example. The most important thing to remember is that the Custom Transformation node only accepts glueContext and DynamicFrameCollection as input and must also return DynamicFrameCollections (collections of DynamicFrames) as output.
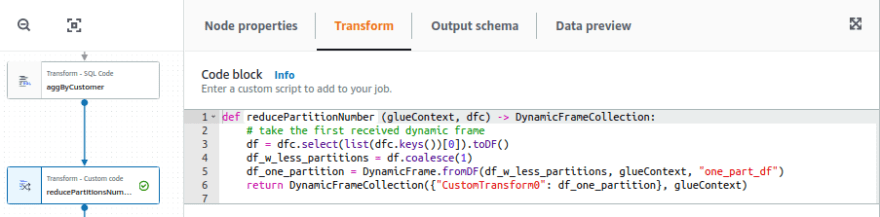
What does it mean? It means that in order to perform any transformations, in the first step you have to choose which DynamicFrame you want to work on. If the transform has only one parent, there is no problem—you choose the first one and convert DynamicFrame to DataFrame:
def reducePartitionNumber(glueContext, dfc) -> DynamicFrameCollection:
  df = dfc.select(list(dfc.keys())[0]).toDF()
Then, you can do whatever Spark transformations you might want. In my case, I want to reduce the number of partitions created, so I do:
df_w_less_partitions = df.coalesce(1)
Then I convert the dataframe back to DynamicFrame and return it as the DynamicFrames collection:
df_one_partition = DynamicFrame.fromDF(df_w_less_partitions, glueContext, "one_part_df")
return DynamicFrameCollection({"CustomTransform0": df_one_partition}, glueContext)
To sum up, the node should look like this:
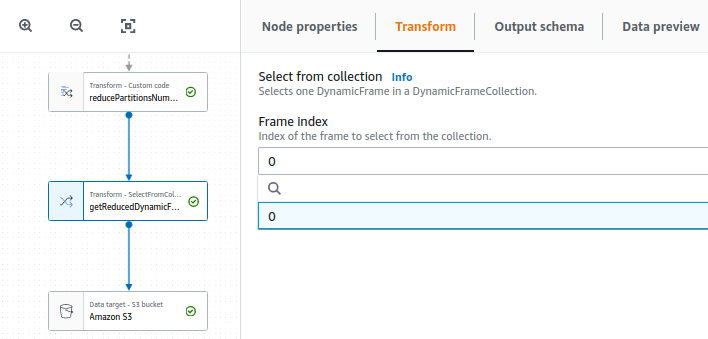
 But that’s not the end. According to the documentation and what you saw above, “A custom code transform returns a collection of DynamicFrames, even if there is only one DynamicFrame in the result set,” and, unfortunately, output nodes do not accept DynamicFrameCollection as input, so you will have to add one more a step that will select a specific DynamicFrame from the collection.
For this step you can use SelectFromCollection transform node which allows you to indicate which dataset you want to use. Since there is only one parent node here, there is only one dataset to choose from.
But if this node had several parents or a parent returning many DynamicFrames (for example SplitFields transformation, which splits dataframe into two separate dataframes), you would have a choice.
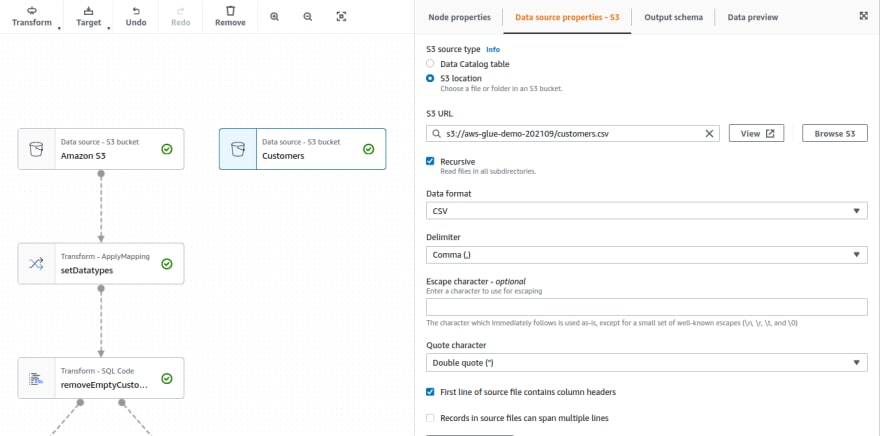
 With that done, we can move on to the last task: adding customer information to the dataframe with aggregates. My analysts loaded the customers.csv file into the main folder aws-glue-demo-202109. File contains the following data: id, name, surname, address.
In our job, we first add another source that will directly reference the CSV file contained in S3 bucket. I give this node the name Customers. AWS Glue Studio detects data formats, separators and defines data types by itself.
 Then we will use the Transform - Join node to combine the data from the two sources. This type requires at least two parent nodes, so I’m adding aggByCustomers node as the second source.
Why am I joining here? Well, I’m afraid that joining after reducing the number of partitions (with the getReducedDynamicFrame node) will once again result in multiple partitions, and joining earlier (before the aggregate is performed) is less efficient, since that joining would be performed on larger number of rows.
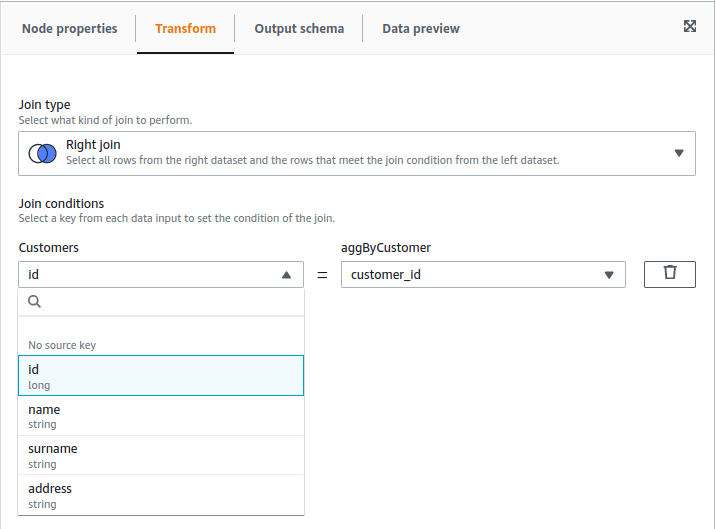
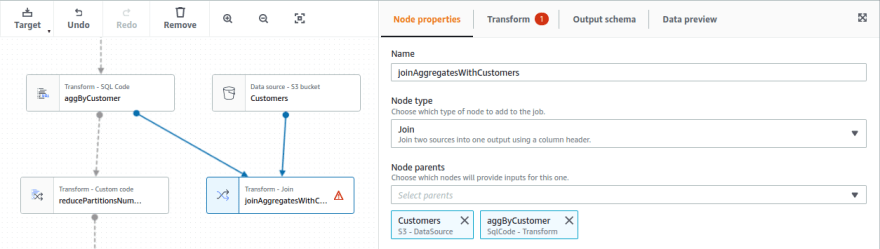 Now you need to select the join type and declare join conditions. Since my left dataset is Customers node, right is aggByCustomers and I know that I don’t have data for all customers, I chose right join. I join those datasets using columns id and customer_id.
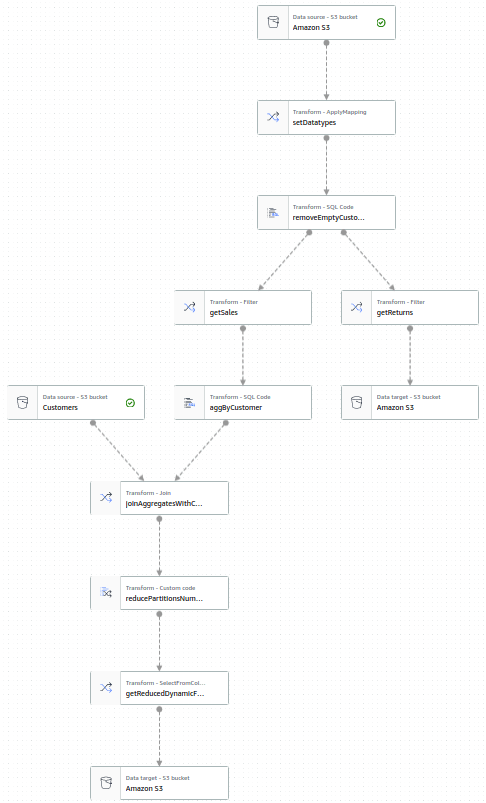
 The last thing to do is to change the parent output of reducePartitionsNumber from aggByCustomers to joinAggregatesWithCustomers and you are good to go. Now the job should look like this:
 Let’s run it and see what happens. Once the job is finished, go to S3 and...
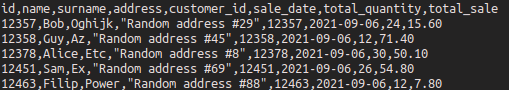
...it’s working! You received only two files:
 In the first one, you’ll have customers with their data (if found) and aggregates:
 In the second one, you’ll have returned items:
 Well, frankly speaking I do not like the order of the columns, because when join did not find the client’s data, it looks like this:
![]() And I don’t see any other way to reorder them than another Spark SQL node, where I would just select the columns in a different order. But let’s leave it as-is. Optionally, I could also use a FillMissingValues transformer node and type, for example, “NOT_FOUND” to fill missing values and make the file more readable.
And I don’t see any other way to reorder them than another Spark SQL node, where I would just select the columns in a different order. But let’s leave it as-is. Optionally, I could also use a FillMissingValues transformer node and type, for example, “NOT_FOUND” to fill missing values and make the file more readable.
How to schedule an AWS Glue job?
At this point, you could say: “Okay, but I don’t want to edit and run my job manually every day.” There are two things that should be set up to automate the whole process.
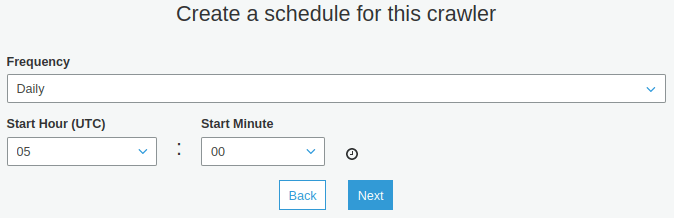
- Automate crawler, so newly added files are visible as consecutive partitions. You don’t have to create a new crawler—you can edit an existing one. Choose a crawler, click Action -> Edit Crawler and hit Next until you reach step number #5 (Create a scheduler for this crawler.) Choose Daily instead of Run from demand and then you can set up the time.
 We go through the next steps and save changes. If everything’s gone well, you should see that a scheduler appeared in the crawler:

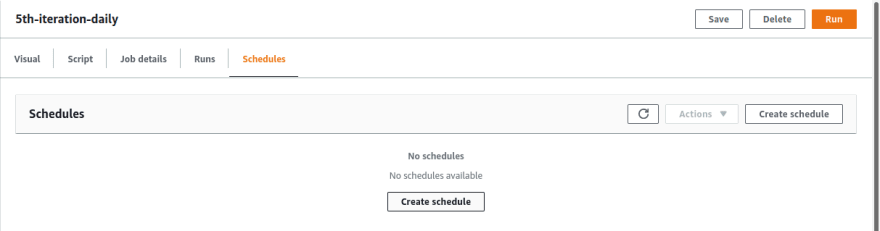
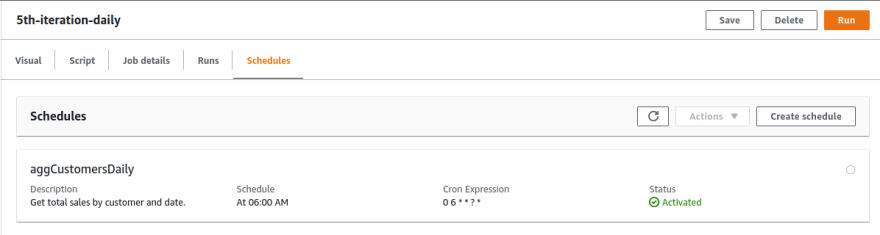
- The second thing is job automation. First, create a job scheduler, which is a relatively simple task. Go to the created job and click the Scheduler tab. You’ll immediately see the options to create a new scheduler:
 You can set up a scheduler name, choose its frequency (Hourly, Daily, Weekly, Monthly, Custom) and, optionally, add a description. I set up a job scheduler to run one hour after the Glue scheduler.
 Now, it would be great if you did not have to manually change the date for which the aggregates are to be made. The easiest solution would be to modify the Partition predicate function in the source node, so it automatically extracts year, month and day from the current date.
year == year(current_date) AND
month == month(current_date) AND
day == day(current_date)
Note: please keep in mind that the months and days are not integer values (01, 02, 03, etc.), and Spark functions Extracts the month as an integer from a given date/timestamp/string. So, you would have to once again reorganize your bucket structure.
For those interested in more advanced solutions, please read about passing custom parameters to Glue Job (since AWS Glue Studio also allows you to pass up to 50 custom parameters) in this article on Calling AWS Glue APIs in Python—AWS Glue.
When should you use AWS Glue Studio?
You might be wondering when you should use AWS Glue Studio. Let’s focus on Glue Studio, not Glue as a whole service.
AWS Glue Studio is great if you want to:
- quickly create ETL jobs that run regularly,
- combine large amounts of data from many different sources,
- and perform simple transformations such as rename or drop fields, join, split, or filter dataframe.
Since you can see and copy the code, a job prepared in Studio could be used as a starting point for a larger, more complex job in Glue.
And when is it not that useful? For instance, when you are looking for a job orchestrator that allows you to repeat your work from any step, use sensors to wait for a file, among other things, you will be better off with Step Functions or Airflow. If you are looking for a data preparation tool, DataBrew would be a better choice since it offers way more data transformation options.
Also, please keep in mind that AWS Glue Studio is not free. When you create a job you have to declare the number of workers (a minimum of two) and choose one of the two possible instance types: G.X1 or G.X2. In G.X1, each worker maps to one DPU and one executor, which launches with eight Spark cores and 10 GiB of memory. G.X2 doubles those values. And you are charged an hourly rate based on the number of DPUs used to run your ETL jobs.
What are the pros and cons of AWS Glue Studio?
One of the main advantages of AWS Glue Studio is the fact that, except for just one step, I didn’t need to use any programming language to create the above-mentioned ETL job.
What is not obvious can often be played around with a Spark SQL query. Integrating AWS Glue Studio with S3 or Data Catalog and scheduling jobs is extremely easy, and the same applies to job scheduling. Besides, let’s not forget that you can get data from streaming services like Kinesis or Kafka.
What’s more, in AWS Glue Studio we can monitor all the jobs in one view, and Job bookmarks is a very handy feature, too.
The main disadvantage is definitely the UI, which is a bit clumsy. It can hang and behave unpredictably at times. Since you can’t manually move nodes, larger jobs might be unclear at some point.
For users unfamiliar with Spark, the limited number of transforms might be a big pain in some cases. And, the latest version does not support all features such as Data Preview, which is something you will find out only when you try to run it.
Final thoughts on building complex data pipelines with AWS Glue Studio
Here is what you’ve accomplished by following the instructions in this article:
- took files from both Data Glue Catalog and S3 directly,
- applied data types,
- removed unwanted data,
- divided the data based on certain values,
- did some joins and aggregations,
- reduced the number of partitions,
- saved the results to desired paths in an S3 bucket.
As you’ve seen in this tutorial, building complex data pipelines doesn’t need to be challenging. I hope you’ve enjoyed following the instructions and learnt a bit more about AWS Glue Studio.
Here are some other articles you might find useful:
- Python for Data Engineering: Why Do Data Engineers Use Python?
- How to Build a Spark Cluster with Docker, JupyterLab, and Apache Livy—a REST API for Apache Spark
- Machine Learning Implementation and Project Management: A How-To Guide
In the article, I used a dataset provided by Dua, D. and Graff, C. (2019). UCI Machine Learning Repository [http://archive.ics.uci.edu/ml]. Irvine, CA: University of California, School of Information and Computer Science.

Top comments (0)