
These are some questions that are related to statistics
1. Where you have used Hypothesis Testing in your machine learning solution?
Answer: Hypothesis testing is one of the statistical analysis where we test the assumption made for any particular situation. While testing some assumption which was claimed to be true I performed the hypothesis testing where the null hypothesis was that whatever claimed results to be true and the alternate hypothesis was that whatever claim was made was false.
2. What do you understand by P-value? And what is the use of it in machine learning?
Answer: P-value which is also know as probability value, it the probability of null hupothesis to be true. It sets the rule to reject null hypothesis.
If the p-value is less than the significance value then we reject the null hypothesis or else accept it.
If the p-value falls in the 95% of the confidence interval then we will accept the null hypothesis.
3. Which type of error is sever error, Type1 or Type2? And why with example.
Answer: To answer of this question is it depends. It depends on the problem statement we are looking into.
For example:
The confusion matrix with regards to disease vs treatment is fatal in case of false negative (when patient have the disease and the model predicted that patient dont have the disease) then in that case patient wont get the treatment and might loose his/her life.
Similarly in criminal is guilty or innocent case false positive is is much more worse (when the person is inncent and the model predicts person is guilty) as we will end up punishing an innocent.
4. Can we use Chi-Squared with numerical dataset? If yes, give example. If no, give reason.
Answer: Chi-Squared generally deals with categorical data rather than only numerical data.
Chi Sqauared finds the differences or it compares two or more groups with a value, or to compare two or more groups.
5. What do you understand by ANOVA testing?
Answer: ANOVA stands for Analysis of Variance. It is an extenstion of T-Test.
In T-Test we test if there is any difference in mean and it can only test of two groups at a time, so if there are more than 2 groups instead of performing T-Test multiple times we go for ANOVA testing.
ANOVA testing looks for two different types of variations:
- variation within groups
- variation between groups To test ANOVA our hypothesis will be:
null hypothesis: There is no difference in means
alternate hypothesis: Atleast or mean differs from the other means
There are two type of ANOVA:
- One way ANOVA
- Two way ANOVA
One way ANOVA: When we want to test two groups and see if thee is any difference.
Two way ANOVA: When we test twice for the same group.
6. Give me a scenario where we can use the Z-test and T-test.
Answer: We use either of the test depending on:
Sample size:
When sample size is large or greater than 30 we use Z-test else T-test
Population variance:
When population variance is known, we use Z-test else T-test
Distribution:
If normally distributed we perform Z-test else T-test
7. What do you underdstand by inferential statistics?
Answer: When we try to form a conclusion about the population by conducting the experiments on sample taken from the population.
8. When you are trying to calculate standard deviation or variance, why you used n-1 in denominator?
Answer: Having denominator as n-1 corrects the biasness in the estimation of the population variance.
So, for example:
- if we have data points where the population mean is not inside the sample points
- now, if we take the sample mean and the distance between the sample points to the sample mean, that will be much lower estimate as compared to population variance
- this could lead to underestimating the population variance
- hence by dividing the denominator by n-1 which makes the denominator much smaller and in turn gives high value for the sample variance which will be unbiased estimate'
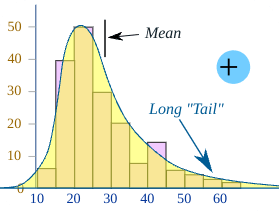
9. What to do you understand by right skewness? Give example.
Answer: When the data is not normally distributed and we have tail type elongated line on the right side, that is called right skewness.
For example:
Income distrubution.
10. What is the the difference between normal distribution, standard normal distribution and uniform distribution?
Answer:
Normal distribution
- it is a density curve which is a bell shaped curve
- has the tendency of the data to cluster around the central value which is also known as population mean
- has a total area of 100%
Standard normal distribution
- it is a special type of normal distribution which has the mean as 0 and the standard deviation as 1
Uniform distribution
- this distribution has the values which lies between certain range/boundary

Top comments (0)