As developers, we often focus on getting our code to work, but sometimes overlook the performance implications of our design choices. In this post, we'll explore how a seemingly minor difference in code can significantly impact performance, using a real-world example from our own system.
The Scenario
We have two versions of code that achieve the same goal: fetching user points from a point server. The first version is optimized, while the second is less efficient. Let's dive into both and see why one outperforms the other.
Version 1: Optimized Code
userList, count, err := u.repo.GetAllUserDB(limit, offset, orderBy, sort)
if err != nil {
    return err
}

conn, err := u.pointServiceConnectionPool.Get()
if err != nil {
    return fmt.Errorf("failed to get connection from pool: %v", err)
}
defer u.pointServiceConnectionPool.Put(conn)

client := pb.NewPointServerClient(conn)

ctx, cancel := context.WithTimeout(context.Background(), 5*time.Second)
defer cancel()

userIDs := []string{}
for _, user := range userList {
    userIDs = append(userIDs, user.ID)
}

r, err := client.GetUserListPoints(ctx, &pb.UserListRequest{UserIds: userIDs})
if err != nil {
    u.logger.Error("failed to get points for users", zap.Error(err), zap.Any("userIDs", userIDs))
    return err
}
userPoints := r.GetUserPoints()
for k, v := range userPoints {
    u.logger.Debug("user points", zap.String("user_id", k), zap.Any("points", v))
}

userList = updateUserListWithPoints(userList, userPoints)

return nil
Version 2: Inefficient Code
userList, count, err := u.repo.GetAllUserDB(limit, offset, orderBy, sort)
if err != nil {
    return err
}

conn, err := u.pointServiceConnectionPool.Get()
if err != nil {
    return fmt.Errorf("failed to get connection from pool: %v", err)
}
defer u.pointServiceConnectionPool.Put(conn)

client := pb.NewPointServerClient(conn)

for _, user := range userList {
    u.logger.Debug("fetch user points", zap.String("user_id", user.ID))

    ctx, cancel := context.WithTimeout(context.Background(), 5*time.Second)
    defer cancel()

    r, err := client.GetUserPoints(ctx, &pb.PointRequest{UserId: user.ID})
    if err != nil {
        u.logger.Error("failed to get user points", zap.Error(err), zap.String("userID", user.ID))
        continue
    }
    u.logger.Debug("user points", zap.String("user_id", user.ID), zap.String("user points", r.GetUserPoint()))

    point, err := strconv.Atoi(r.GetUserPoint())
    if err != nil {
        point = 0
    }
    user.Point = point
}
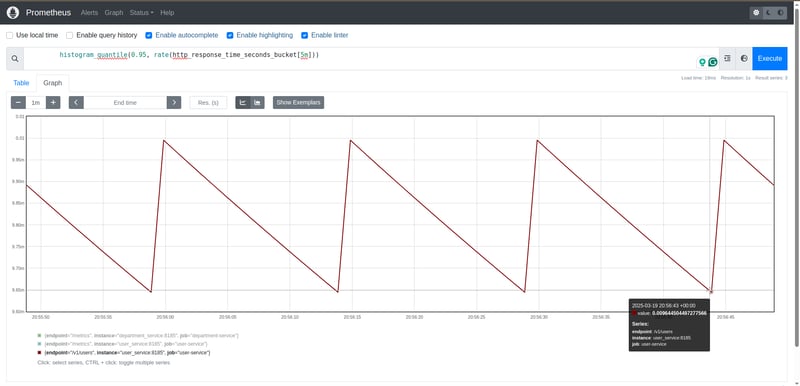
Prometheus Query:
histogram_quantile(0.95, rate(http_response_time_seconds_bucket[5m]))
What's the Difference?
The key difference between these two versions lies in how they interact with the point server:
Version 1 fetches points for all users in a single request using GetUserListPoints. This approach minimizes the number of requests to the server, reducing overhead and latency.
Version 2 fetches points for each user individually using GetUserPoints. This results in multiple requests to the server, increasing both the number of network calls and the overall processing time.
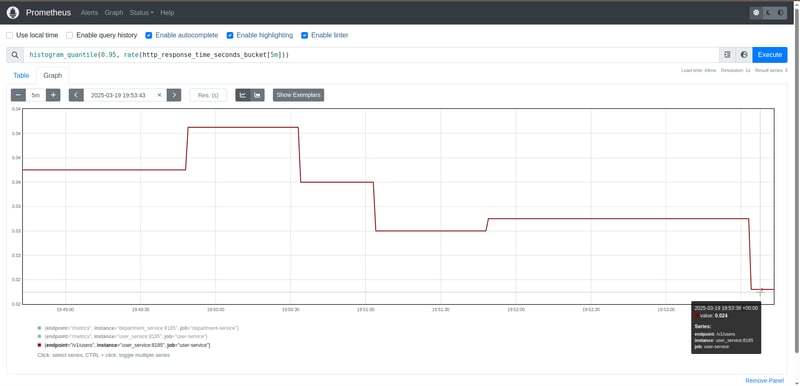
Performance Impact
When we look at the Prometheus graphs for these two versions, the difference is striking. The response time for Version 1 is significantly lower than Version 2. This is because Version 1 reduces the number of requests to the point server, minimizing network latency and server load.
Lessons Learned
Batching Requests: When possible, batching requests can significantly improve performance by reducing the number of network calls.
Efficient API Usage: Using APIs designed for bulk operations can reduce overhead compared to making individual requests.
Monitoring Performance: Tools like Prometheus are invaluable for identifying performance bottlenecks and optimizing code.
Conclusion
Even seemingly minor differences in code can have a profound impact on performance. By optimizing how we interact with external services and leveraging batching, we can significantly improve response times and reduce system load. Always keep an eye on performance metrics and be mindful of how your code interacts with external systems. Small changes can add up to make a big difference in the efficiency and scalability of your applications.

Top comments (0)