
TL;DR: Learn to bind and process OLAP cube data using Syncfusion Vue Pivot Table. This blog guides you through ensuring IIS and Analysis Services are installed and configured, creating an HTTP endpoint using IIS, setting up an application pool and virtual directory, configuring authentication, and adding a script map for msmdpump.dll. Finally, it shows you how to connect the OLAP cube to the Syncfusion Vue Pivot Table in your Vue app for intuitive data analysis and presentation.
An OLAP cube includes dimensions, hierarchies, levels, measures, and named sets. It serves as a powerful tool for analyzing multidimensional data.
Leveraging OLAP data with the Syncfusion Vue Pivot Table facilitates an intuitive presentation and exploration in tabular and graphical (also known as chart) formats. Additionally, reports can be dynamically customized using features such as the grouping bar and field list, and there is also the option to save reports for future use.
To connect multidimensional OLAP data with the Syncfusion Vue Pivot Table, an HTTP endpoint to access an Analysis Services instance is essential. This article will walk you through creating this HTTP endpoint using Internet Information Services (IIS) on a Windows operating system.
Let’s get started!
Prerequisites
Before you enable HTTP access to the OLAP server, ensure that a web server is running to host the web app that will access the OLAP server and that IIS is configured properly.
1.Click on Start in your system and select Turn Windows features on or off.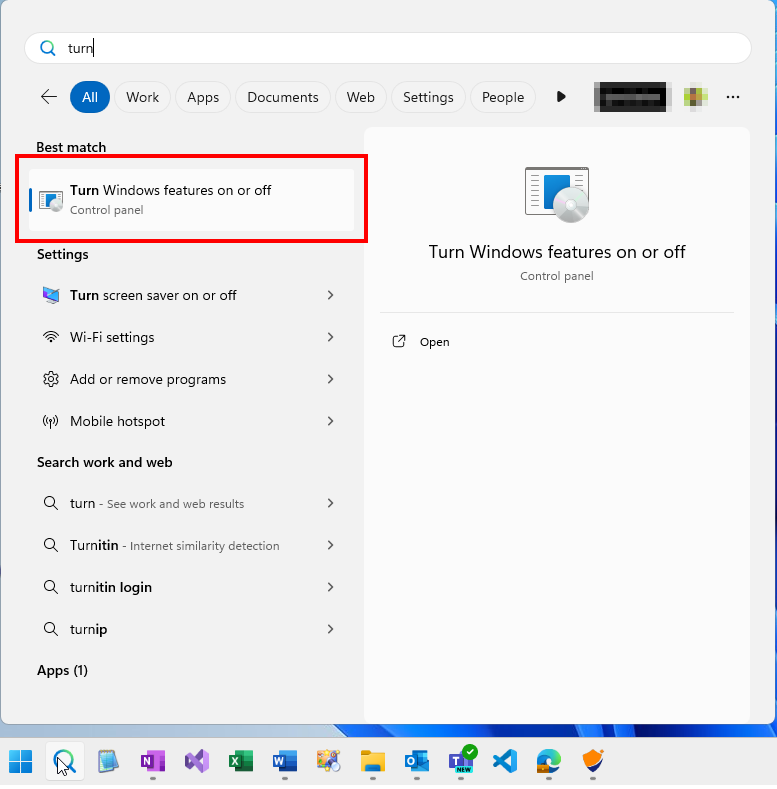
2.Go to Internet Information Services, expand it, and then further expand World Wide Web Services and Application Development Features. Verify that both CGI and ISAPI Extensions are selected.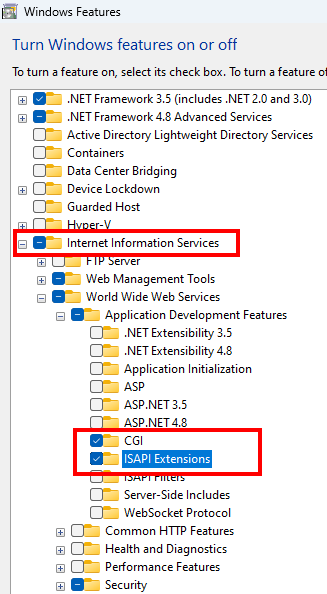
3.Under Security, ensure that Basic Authentication and Windows Authentication are selected.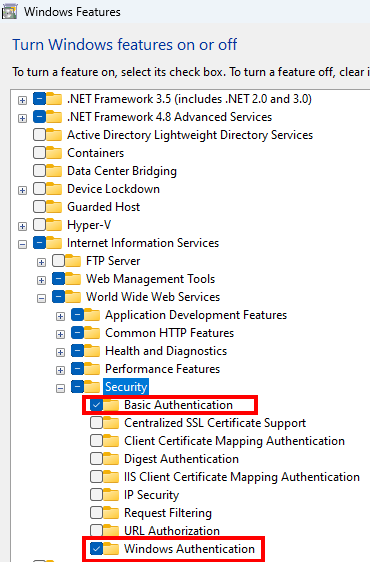
4.Click OK to install the selected features. With these steps, all necessary prerequisites are now configured.
Preparing the IIS server
Before proceeding, confirm that IIS is already configured and that Analysis Services have been installed. If not, follow these steps:
Install IIS
1.Click Start, then select Turn Windows features on or off option.
2.Select Internet Information Services and any other necessary features, then click OK to begin the installation.
3.Once installed, verify by searching for IIS in the Start menu and selecting Internet Information Services (IIS) from the search results.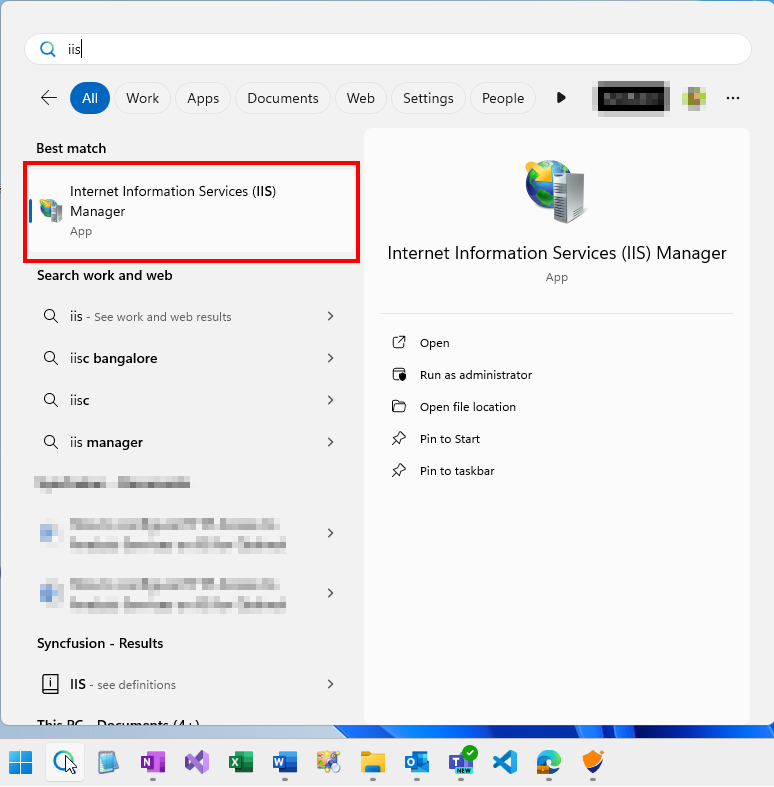
Install SQL Server Analysis Services
To install SQL Server Analysis Services on your machine, follow the instructions provided in the blog.
Once your machine has IIS and Analysis services installed:
1.Navigate to the IIS root directory, typically located at C:\inetpub\wwwroot.
2.Create a new folder named OLAP under wwwroot.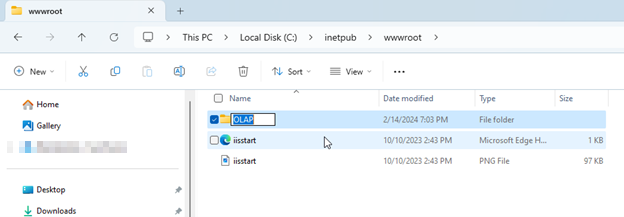
3.Copy the files msmdpump. dll, mdmdpump.ini, and the Resources folder from C:\Program Files\Microsoft SQL Server\MSAS15.MSSQLSERVER\OLAP\bin\isapi (adjust the path according to your installation).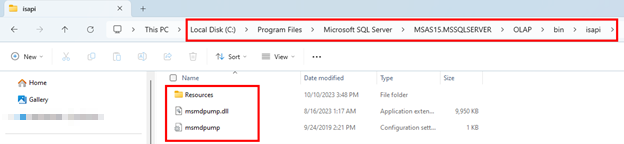
4.Paste these files into the newly created OLAP folder.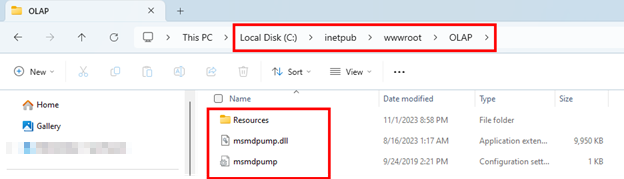
Check that the C:\inetpub\wwwroot\OLAP folder on your machine contains msmdpump.dll, mdmdpump.ini, and the Resources folders. Your folder structure should look like the above image. The IIS directory has now been set up.
Creating an app pool and virtual directory in IIS
To set up an app pool and an endpoint for the pump, follow these steps:
Create an app pool
1.Launch the IIS Manager by entering inetmgr in the Run command window.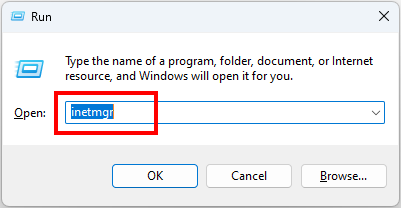
2.Right-click on Application Pools, and then select Add Application Pool.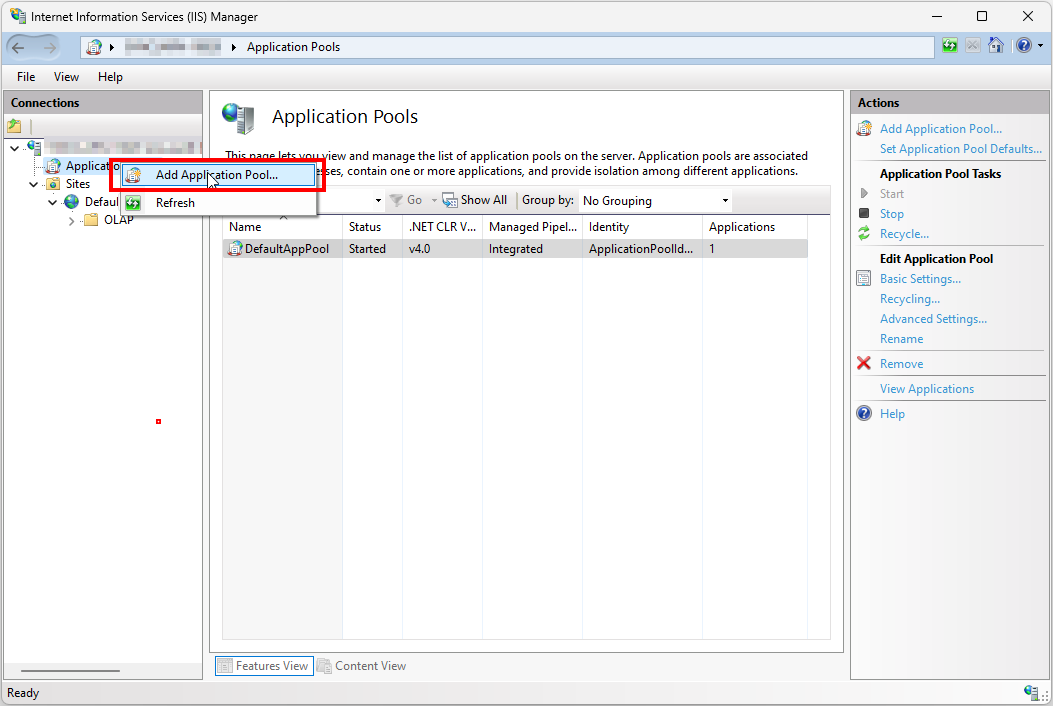
3.Using the .NET Framework, create an application pool named OLAP and set the Managed pipeline mode to Classic. Click OK to complete the process.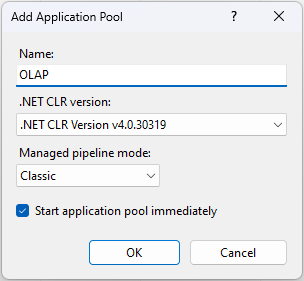
4.By selecting the Application Pools on the left panel, you will see the newly created pool named OLAP.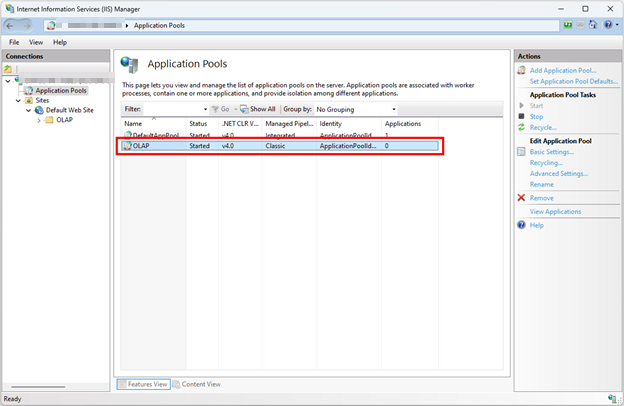
5.By default, IIS creates application pools with ApplicationPoolIdentity as the security identity, which is appropriate for HTTP access to Analysis Services. You can change this identity by right-clicking OLAP and selecting Advanced Settings and the ApplicationPoolIdentity if necessary. Click the Change button next to this property to replace the built-in account with the custom account.
6.For the 64-bit operating system, IIS automatically sets the Enable 32-bit Applications property to false. If you copied the msmdpump.dll from a 64-bit Analysis Services installation, this is the correct MSMDPUMP extension configuration for a 64-bit IIS server. If you copied MSMDPUMP binaries from a 32-bit installation, set the Enable 32-bit Applications property to true. Ensure this property is in Advanced Settings to ensure it is set correctly.
Now, the application pool has been created, but no apps exist. So, we need to create the application now.
Create an application
1.In IIS Manager, go to the Sites section and locate the Default Web Site. You will see a directory named OLAP. This refers to the OLAP folder you previously created under C:\inetpub\wwwroot.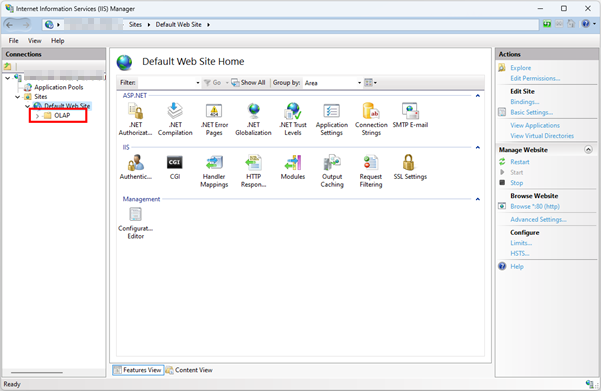
2.Right-click on the OLAP directory and select Convert to Application.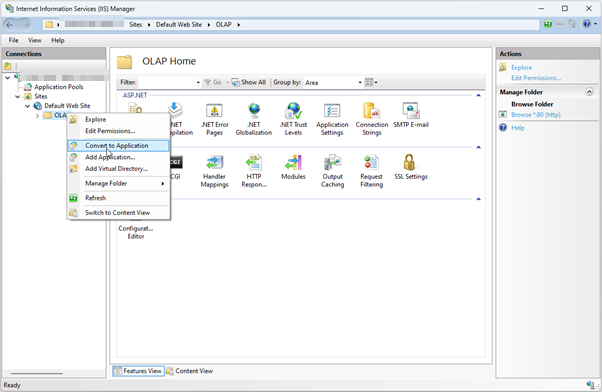
3.In the Add Application dialog, enter OLAP as the Alias. Click Select to choose the OLAP application pool and set the Physical Path to C:\inetpub\wwwroot\OLAP. Finally, click OK.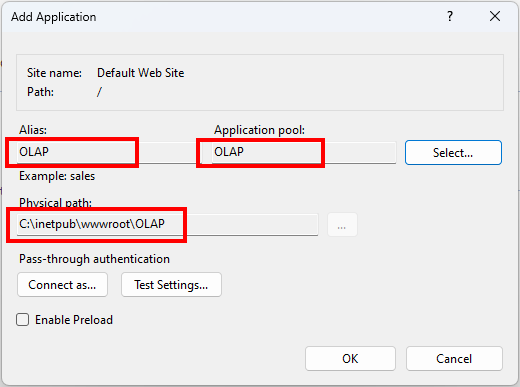
4.When you refresh the website, you will see that the OLAP folder is now shown as an application under the default website. The virtual path to the msmdpump file has now been established.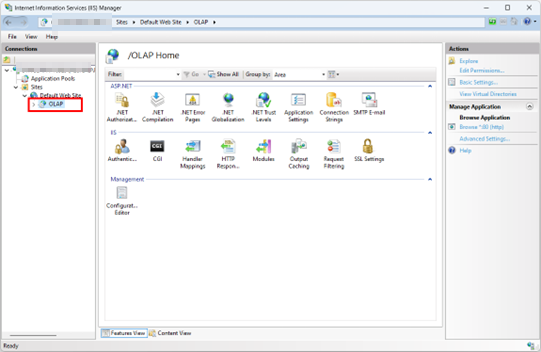
Configure authentication in IIS
1.Select the OLAP application in the left panel, then double-click Authentication.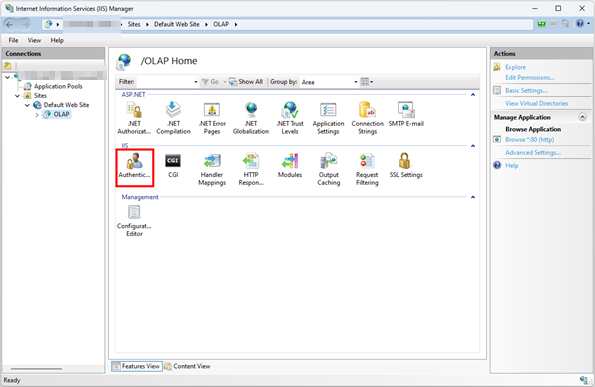
2.Enable Windows Authentication if you are using Windows-integrated security. If your client and server apps are in different domains, enable Basic Authentication. This mode will ask the user to enter a username and password, which are transmitted to IIS via the HTTP connection. When connecting to msmdpump, IIS will attempt to impersonate the user using the credentials provided, but Analysis Services will not be granted access to the credentials. In such cases, you must provide a valid username and password when connecting.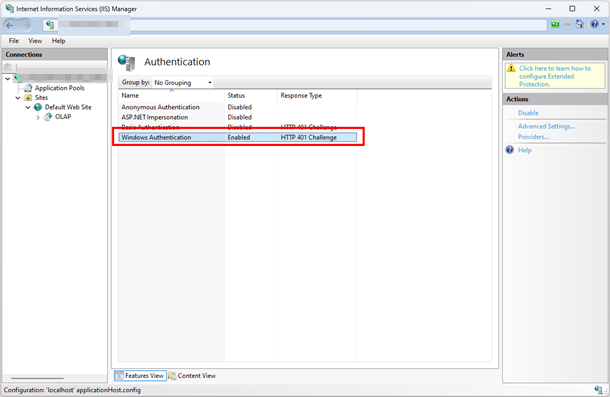
3.If you use Windows or Basic authentication, disable Anonymous Authentication. IIS prioritizes Anonymous authentication when enabled, even if other authentication methods are also enabled.
Adding a script map to the msmdpump.dll
1.Click on the OLAP virtual directory to open the main page, then double-click on Handler Mappings.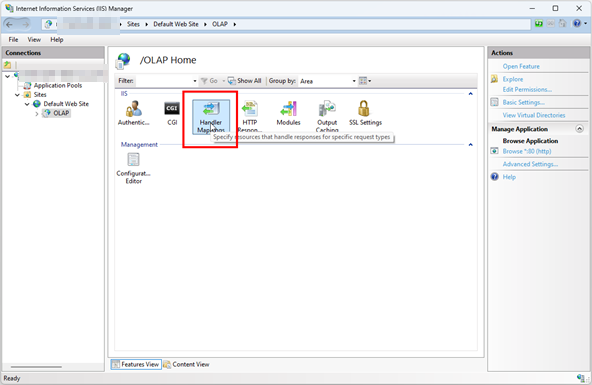
2.Right-click anywhere on the page, then choose Add Script Map. In the Add Script Map dialog, enter *.dll as the request path, C:\inetpub\wwwroot\OLAP\msmdpump.dll as the executable, and OLAP as the name. Keep all the default restrictions on this script map. Then, click OK.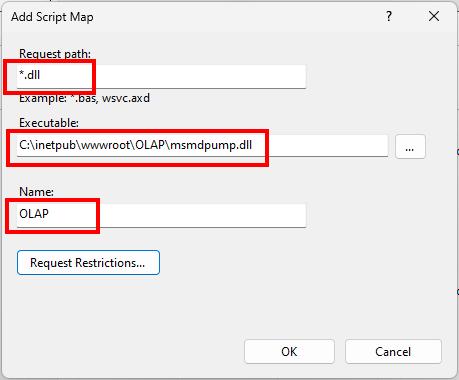
3.When prompted to allow the ISAPI extension, select Yes.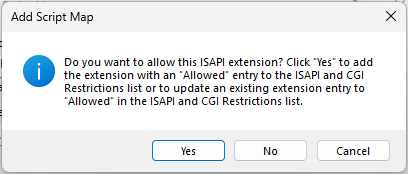
The script map named OLAP will now appear in the Handler Mappings list.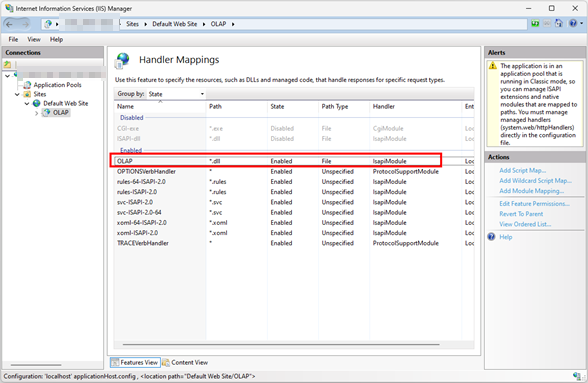
Testing your configuration
The msmdpump connection string syntax is the URL to the msmdpump.dll file. If the web app listens on a specific port, you should include the port number in the server’s name or IP address (e.g., http://localhost:80/OLAP/msmdpump.dll ).
Use Internet Explorer, Microsoft Excel, or SQL Server Management Studio to test the connection quickly.
Testing connections with SQL Server Management Studio
1.Open the SQL Server Management Studio. In the Connect to Server dialog box, choose Analysis Services as the server type. Enter the following HTTP address for the msmdpump extension: http://localhost:80/OLAP/msmdpump.dll.
2.Authentication should be set to Windows authentication, and the user of Management Studio must be an Analysis Services administrator. An administrator can grant additional permissions to other users.
3.Click Connect to establish the HTTP connection.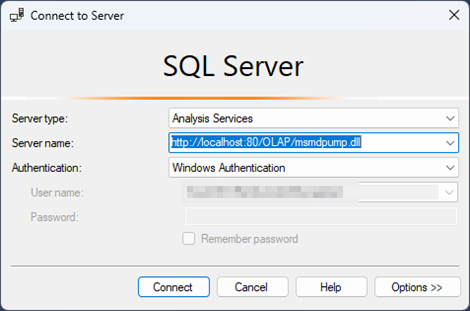
Now, you can connect to the instance and browse all the databases and cubes.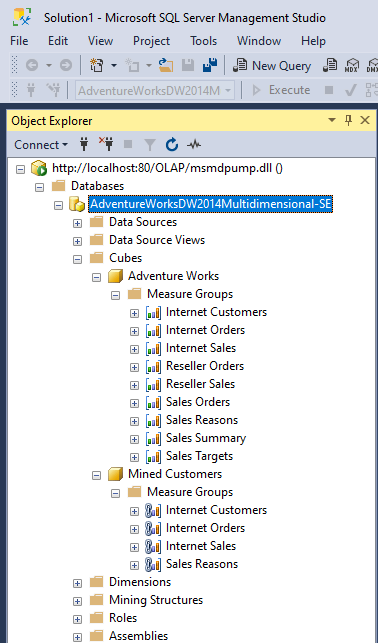
Testing connections using Excel
1.Open the Excel application and go to the Data tab.
2.To launch the Data Connection wizard, click on Get Data, then From Database, and select From Analysis Services.
3.In the Server name field, enter the HTTP address for the msmdpump extension: http://localhost:80/OLAP/msmdpump.dll.
4.If you use Windows integrated security, NTLM, or Anonymous as your login credentials, select Use Windows Authentication. For basic authentication, choose the Use the following User Name and Password check box and then specify the credentials used to sign in. These credentials will be included in the connection string to Analysis Services.
5.You can connect to the instance by clicking Next and browse the databases and cubes.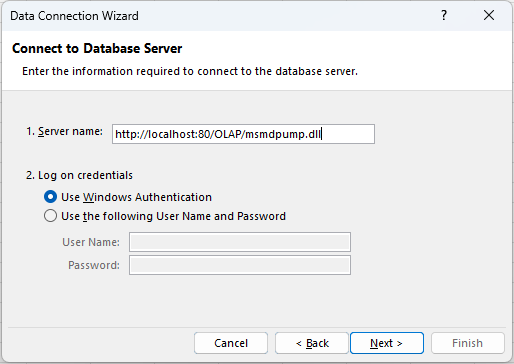
Enabling cross-origin resource sharing (CORS)
Web browsers, by default, prevent JavaScript from making requests across domains, a security measure known as the Same-Origin Policy. CORS (Cross-Origin Resource Sharing) enables web apps to make requests across domains securely. To enable CORS, we must follow these steps.
Configuring HTTP response headers
To configure HTTP response headers, first, you must add the required headers in the OLAP app.
1.In the IIS manager, select the OLAP application in the left panel and then double-click on HTTP Response Headers.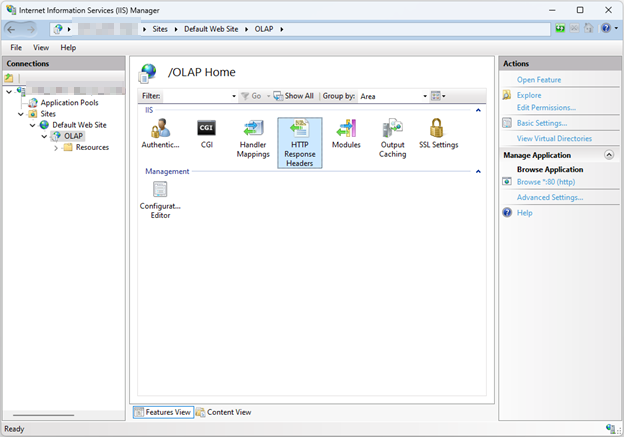
2.Right-click anywhere on the page and select Add. In the Edit Custom HTTP Response Header dialog, set the Name to Access-Control-Allow-Headers and the Value to Origin, Content-Type, and Accept. Finally, click OK to add the header.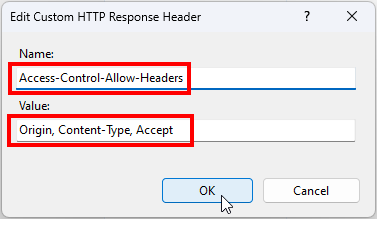
3.Follow the same process to define the remaining two headers: Access-Control-Allow-Origin and Access-Control-Request-Method. The headers should be defined as shown below.
Access-Control-Allow-Headers: Origin, Content-Type, Accept
Access-Control-Allow-Origin: *
Access-Control-Request-Method: POST
Refer to the following image.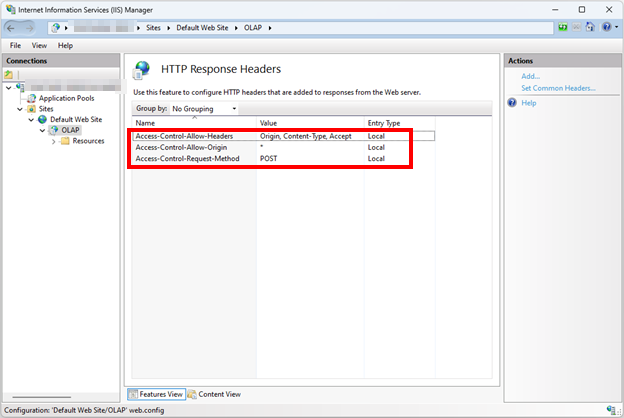
Configuring the OPTIONSVerbHandler
1.In the IIS manager, select the OLAP application in the left panel and double-click Handler Mappings.
2.Next, double-click on OPTIONSVerbHandler to open the Edit Module Mapping dialog.
3.Now, choose the Request Restrictions button.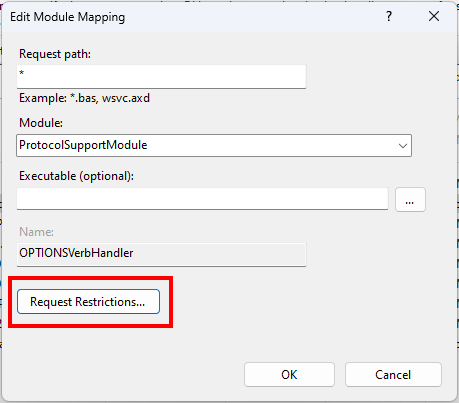
4.In the Access tab, select Read and then click OK.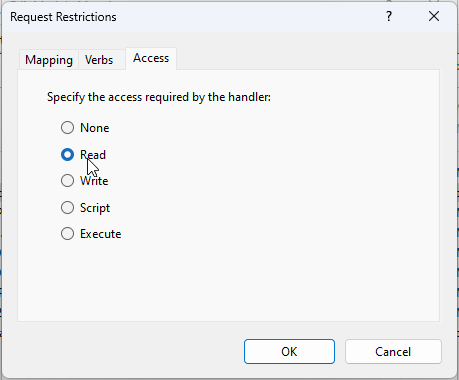
5.On the right panel, click View Ordered List and ensure that OPTIONSVerbHandler is at the top of the Handler Mappings list.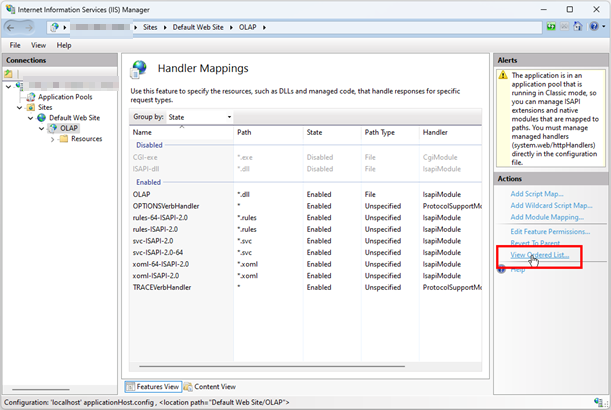
6.If not, select the OPTIONSVerbHandler and use the Move Up command in the Actions menu to bring it to the top of the list.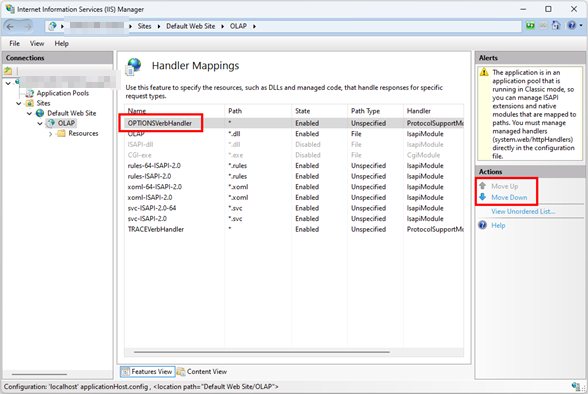
Connecting the OLAP cube to the Pivot Table
To connect the OLAP cube, ensure the Syncfusion Vue Pivot Table is integrated into your Vue app. If this integration is not yet in place, follow the installation and setup instructions provided by Syncfusion in the documentation.
Once created, configure the report below, replacing the url, catalog, cube, and providerType properties with your values.
[app.vue]
<template>
  <div id="app">
    <ejs-pivotview :dataSourceSettings="dataSourceSettings" :height= "height"> </ejs-pivotview>
  </div>
</template>

<script>
import Vue from "vue";
import { PivotViewPlugin } from '@syncfusion/ej2-vue-pivotview';

Vue.use(PivotViewPlugin);

export default {
  name: 'app',
  data () {
    return {
      dataSourceSettings: {
            catalog: 'AdventureWorksDW2014Multidimensional-SE',
            cube: 'Adventure Works',
            providerType: 'SSAS',
            url: 'http://localhost:80/OLAP/msmdpump.dll',
            enableSorting: true,
            localeIdentifier: 1033,
            rows: [
                { name: '[Customer].[Customer Geography]', caption: 'Customer Geography' },
            ],
            columns: [
                { name: '[Product].[Product Categories]', caption: 'Product Categories' },
                { name: '[Measures]', caption: 'Measures' },
            ],
            values: [
                { name: '[Measures].[Customer Count]', caption: 'Customer Count' },
                { name: '[Measures].[Internet Sales Amount]', caption: 'Internet Sales Amount' }
            ],
      },
      height: 350
    }
  }
}
</script>

<style>
@import '../node_modules/@syncfusion/ej2-base/styles/material.css';
@import '../node_modules/@syncfusion/ej2-buttons/styles/material.css';
@import '../node_modules/@syncfusion/ej2-dropdowns/styles/material.css';
@import '../node_modules/@syncfusion/ej2-grids/styles/material.css';
@import '../node_modules/@syncfusion/ej2-inputs/styles/material.css';
@import '../node_modules/@syncfusion/ej2-lists/styles/material.css';
@import '../node_modules/@syncfusion/ej2-navigations/styles/material.css';
@import '../node_modules/@syncfusion/ej2-popups/styles/material.css';
@import '../node_modules/@syncfusion/ej2-calendars/styles/material.css';
@import "../node_modules/@syncfusion/ej2-pivotview/styles/material.css";
</style>
After configuring the reports, execute the project using the command npm run dev. The Pivot Table will now be presented, as illustrated below.

GitHub reference
For more details, see the demo in this GitHub demo.
Conclusion
Thanks for reading! In this blog, we have learned how to set up HTTP access to analysis services on IIS for optimal OLAP cube analysis and connect it to the Syncfusion Vue Pivot Table. So, try the steps explained in this blog, and share your thoughts in the comments section!
Our Pivot Table is a versatile component available across our Blazor, ASP.NET (Core, MVC), JavaScript, Angular, React, and Vue suites. Use it to organize and summarize business data elegantly in any app!
For our existing customers, the latest version of Essential Studio can be downloaded from the License and Downloads page. If you are new to Syncfusion, try our 30-day free trial to explore the available features.
For questions, you can contact us through our support forum, support portal, or feedback portal. We are always happy to assist you!

Top comments (0)