
Original article here: https://dashbird.io/blog/operational-excellence-serverless-application/
Managing applications at scale often comes up as one of the biggest concerns for businesses; How can it work smoothly? How do we monitor so many resources? How do we maintain best practices with constantly evolving infrastructure? In this article, we run through the best approach for operational excellence looking at serverless monitoring strategy, serverless alerting strategy, and security and compliance best practices.
The Serverless Challenge
In a containerized application, there would be anywhere between 5-20 servers with business logic within them. To monitor this, an agent would simply be attached to oversee the entire system and alert of any issues. The serverless model is quite different, as we know. At scale, there can be thousands of resources using tens of different services making monitoring and alerting much more complex.
A typical serverless application would look like this:

Challenge 1:
The volume of data from a serverless application grows exponentially, particularly if we consider that for everyone resource there are at least five pieces of related data. Think logs, metrics, traces, and configuration data.
Challenge 2:
As* infrastructure grows, so does the variety of failures. While we may know of a few points of failure within our own infrastructure, it's near impossible to know them all*. For this reason, it's best to view each resource as a potential source of failure that must be monitored.
The Solution
Observability.
Different from visibility, observability is the measure of the internal states of a system inferred by the knowledge of its external output.
Using this method requires no interference and instead puts data output to work, helping to visualize and understand the health and performance of the serverless application.
For success, it's a case of breaking the traditional silos of data and sorting and organizing the mass volume into workable, relevant, and actionable insights.
Serverless Application Monitoring Strategy
A strategy for serverless monitoring is key to understanding how your application is running, gathering insights, and discovering opportunities for performance and cost optimization.
First, let's look at the primary goals of monitoring:
- Reduce time to discovery for customer-affecting incidents.
- Increased confidence in building quickly and iterating products with minimal risk.
- Enabling developers to focus on customers, not operations.
- To learn from mistakes, and to pre-empt more issues.
Next, we need to conduct some risk mapping (SLAs) making clear what parameters are acceptable.
- What are the application requirements for Speed, Uptime and Cost. These three elements are intertwined and dependent on each other, so it's important to make this clear early on.
- What is the acceptable time to discover failures?
- After discovery, what is the acceptable time to fix an error or failure?
Finally, state clearly the requirements of having monitoring in place. This may be completely obvious but it's important to have these referrals any time it goes off track.
- For the infrastructure to ingest, navigate and interrogate the data.
- To detect failures as quickly as possible.
- To debug the system quickly and understand the issue efficiently.
Statements and requirements now made, next is the best approach to navigating and monitoring data. It's important to democratise away from silos for true interrogation and useful analysis. This means breaking down traditional barriers between logs, metrics and tracing data. Having a unified view through correlating metric events from log events, and having cross region and cross account visibility provides better context within the bigger picture of the application. It's also important to have the ability to look at data differently making the data really work for you and your needs. This might look like various reports, a dashboard or search and query functions.
Arguably, however, the most important quality for serverless monitoring is elasticity. We need the architecture to automatically digest the changing data from constantly changing resources, without the overhead of importing or configuring the data to make it readable. This is how Dashbird makes full use of elastic data ingestion.

While big picture views are important, so are specific level views.
Account and Microservices Level
Goal: to detect major problems and fix these as early as possible.
Through this specific lens, we can understand trends for overall application health, the most concerning areas as well as cost and activity metrics.
Resource Level
Goal: to understand the specific resource's health, performance, costs, and associated problems.
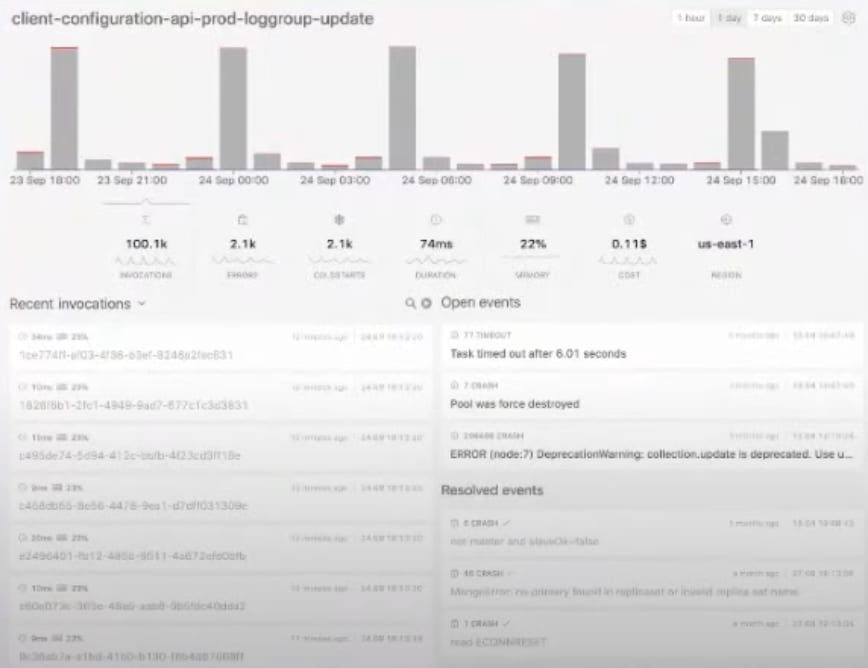
Given this is a place where developers spend most of their time, it's one of the most important views to include in your strategy. Looking at a Lambda resource, for example, there are multiple areas to analyze: invocations, errors, cost, cold starts, and memory usage. We need to be able to drill down into anomalies, and past and present errors in order to improve and better align with best practices. Here is how Dashbird does this:
Execution Level
Goal: to understand the problem in detail.
It's at the execution level that we are able to source full activity details like duration, memory usage, and start and end times for issues and optimization. Going deeper though, we can look at the profile of the execution; requests to other resources, how long it took, and its level of success. We can also detect retries and cold starts here.

It's with excellent monitoring, we can defend against known and unknown failures.
Serverless Application Alerting Strategy
For true operational excellence, monitoring needs to be paired with a good serverless alerting strategy. Failures and errors are inevitable and so reducing the time to discover and fix is imperative. As discussed, monitoring needs to be constant with preemptive checks continuously running for security, best practice, cost, and performance. However, we also need to be able to filter log events for errors and failures; this is the first step in the alerting strategy.
Failure Detection from Logs
Filtering log streams in real-time to detect failures is critical to operations. Dashbird has automated alerts for log data coming in, without the need for any code changes or agents. Filtering is also possible with other systems, however, it can be lengthy to set up and difficult to maintain as changes to serverless architecture takes place over time.
Metric Alarms
Understandably crucial is the use of metric alarms, however, a common challenge is the scale of metrics and what to prioritize without too much noise.
We recommend starting with customer-affecting metrics. For example, starting with an API Gateway and going downstream to the function and database used on that journey. All of these components should ideally be monitored. However, an alternative for those with time constraints is to focus on the API only. From here, errors or latency issues will inevitably show up for which you can investigate when needed.
Leading indicators is another great metric to prioritize for maximum impact. For resources with high memory usage, for example, there can be an increased delay in downstream services. This snowball effect can add a huge amount of strain making it important to identify early.
Operational excellence also takes into account efficient spending, and so cost monitoring and alarms are good to include in your strategy too. While you might not have many risks of unexpected increased costs, we recommend setting up limits and alerts from the start, ticking off one less thing to have to worry about.
When it comes to your alerting strategy, do it programmatically and centralize the alerts with other alerts. A serverless application is already heavily intertwined and so it makes perfect sense for the alarms to have some level of integration too.
A Dashbird example of the alerts available:

Serverless Security and Compliance Best Practice
Serverless best practice involves continuous risk management and assessment of optimization opportunities. Things like encryption, habitually setting up functions with the rule of least privilege and detecting redundant services to improve costs are all part of this. Dashbird continuously checks across the whole infrastructure to ensure this:

Also in best practice is to plan and proactively practice incident management. Test failures and errors in a staging environment on a regular basis, often once a quarter is enough but the practice depends on the size and impact of the failure -- an important consideration.
For unplanned incidences, it's always best practice to document them, setting time aside for review to prevent it from happening again. Importantly too, tracking actual performance against stated goals and SLAs helps to give a full view of the application's success and areas that can be improved.
It goes without saying that operational excellence takes a lot of time and practice, especially in serverless.
Some things you can do today to get started or continue doing:
- Read the AWS Well Architected Serverless Whitepaper.
- Work with AWS solutions architects and the serverless community.
- Use third-party tools to implement best practices. There are many on the market with free trials, like Dashbird, reducing risk and commitment.

Top comments (0)