Grafana has long been a favourite of ours for creating stunning visualisations. It's lightweight, easy to get started with and, over time, has added a lot of new features without losing simplicity.
Yet, we have shied from recommending Grafana to our IoT customers over, say, the TICK stack from Influx or ODFE/Kibana.
A typical IoT workflow has three main blocks on the cloud and a lot of product builders are thrown off by the complexity of integrating these while maintaining data security and access control.
Of these, Grafana only does visualisation and is spectacularly good at it. You need to find your own solutions for data ingress and storage. Sure, Grafana has plugins for most data sources you have heard of and many more you haven't. Yet, most of these require you to set up your own servers.
We previously explored integrating AWS Timestream with Grafana. Back then, we used the managed service from Grafana.com. With AWS now offering managed services for IoT ingress, time series data storage and Grafana, the integration and security challenges should largely be solved, right? Let's find out.
Setting up Grafana Instance
Like the best managed offerings from AWS, setting up and configuring Grafana is a breeze. There's a wizard led flow once you click on "Create Workspace".
AWS uses SSO for access control - this is powered by AWS Organizations behind the scenes. More about this in a bit.
IAM policies can be enabled with a click or you can configure these yourself.
Once we are done with the wizard, we enable the newly created user for access. In a couple of minutes our brand new Grafana instance is ready for use. We are brought to this friendly and useful summary.
Accessing & Configuring Grafana
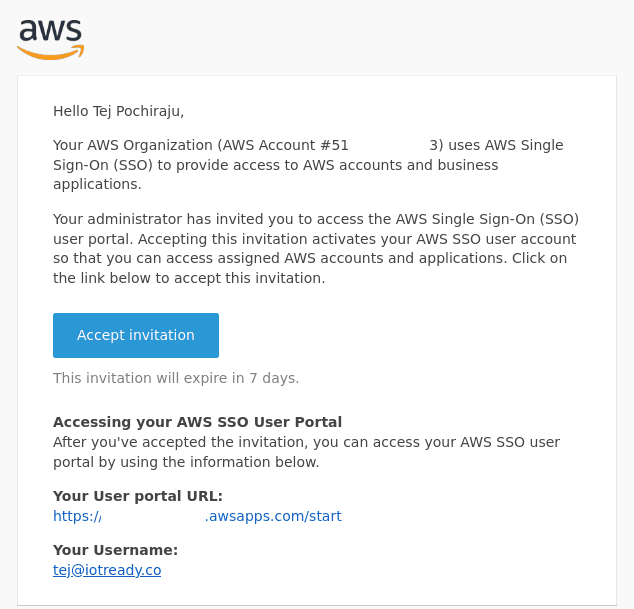
While we were busy clicking Next a few times, AWS created a new Organisation, sent a confirmation email to the logged in IAM user and another invitation email to the SSO user we created.
Accepting the invitation allows us to set up a password for this user which we will need when accessing the Grafana instance.
Once we login, the interface is an AWS white-labeled version of the standard Grafana UI with a section for AWS specific data sources.
As one would expect, finding and setting up our Timestream DB as the default data source is also a matter of a few clicks.
Setting up Dashboards & Alerts
We have previously described how to send data to AWS IoT and from there into Timestream. Once that is configured, we send data using our trusty Python script.
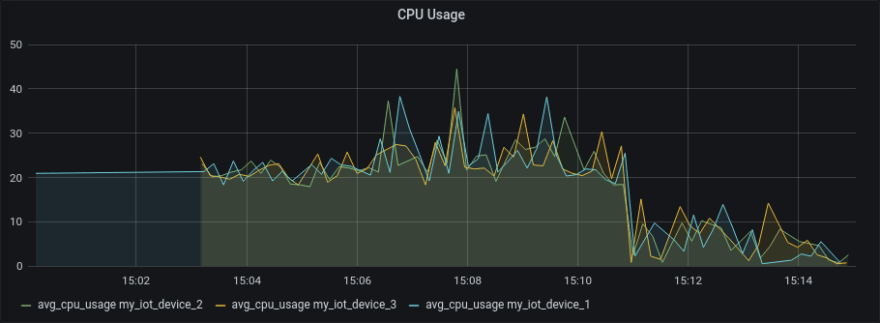
Setting up a dashboard and panel is also exactly the same as in the previous article and we end up with, surprise, a similar panel.
The alerts workflow is the same as usual - with the exception that AWS SNS is the first option in notification channels. Once the alerts are configured, we see them on the Alerts dashboard within Grafana.
SNS is really easy to configure from within the AWS Grafana Console (where we saw the summary earlier). We will explore this integration in a future post.
Reflections
The advent of managed services from AWS (and others) has enabled cloud infrastructure to be configured rather than developed. For most IoT applications, a product builder can probably just pick one of the following configurations.
There are differences to consider, of course.
Features
- ODFE has anomaly detection built-in
- ODFE's authentication system supports multi-tenancy and granular data source level access controls out of the box.
- Grafana has viewer and editor roles and it's not obvious how to implement data source level access control.
- Grafana allows you to ingest and visualise data from multiple data sources.
- Grafana has a lot of visualisation plugins with a well documented flow for building new plugins.
Pricing
- ODFE does not have a pay-as-you-go model - you pay for the hosted ElasticSearch instance(s). Expect to pay $40-$80 per month for <100,000 devices. There are no limits to the number of users you can add to the system.
- AWS Managed Grafana costs $9/editor and $5/viewer per month. The prices are similar to that for QuickSight.
Ecosystem
- Timestream is relatively new and the data model takes a little getting used to. Moreover, you have to use official AWS SDKs to access data for custom applications.
- ElasticSearch/ODFE, being a lot more mature, have numerous SDKs to access data and build custom interfaces.
For these reasons, and to avoid vendor lock-in with Timestream, we will continue to recommend ODFE over Grafana.
Questions, comments? Connect with us at hello@iotready.co.


Top comments (0)