A short while ago I published a rather technical post on the development of a python-based attribution model that leverages a probabilistic graphical modeling concept known as a Markov chain.
I realize what might serve as better content is actually the motivation behind doing such a thing, as well as providing a clearer understanding of what is going on behind the scenes. Bonus: At the end you can grab the code to do this yourself in Python! So to that end, in this post I'll be describing the basics of the Markov process and why we would want to use it in practice for attribution modeling.
What is a Markov Chain
A Markov chain is a type of probabilistic model. This means that it is a system for representing different states that are connected to each other by probabilities.
The state, in the example of our attribution model, is the channel or tactic that a given user is exposed to (e.g. a nonbrand SEM ad or a Display ad). The question then becomes, given your current state, what is your next most likely state?
Well one way to estimate this would be to get a list of all possible states branching from the state in question and create a conditional probability distribution representing the likelihood of moving from the initial state to each other possible state.
So in practice, this could look like the following:
Let our current state be SEM in a system containing the possible states of SEM, SEO, Display, Affiliate, Conversion, and No Conversion.
After we look at every user path in our dataset we get conditional probabilities that resemble this.
P(SEM | SEM) = .1
P(SEO | SEM) = .2
P(Affiliate | SEM) = .05
P(Display | SEM) = .05
P(Conversion | SEM) = .5
P(No Conversion | SEM) = .1
This can be graphically represented.
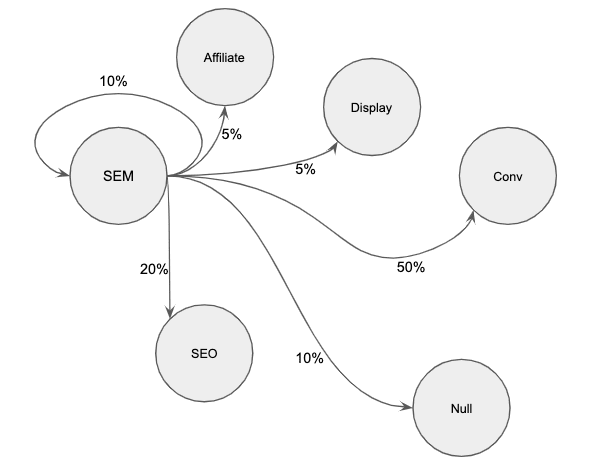
Notice how the sum of the probabilities extending from the SEM state equal to one. This is an important property of a Markov process and one that will arise organically if you have engineered your datset properly.
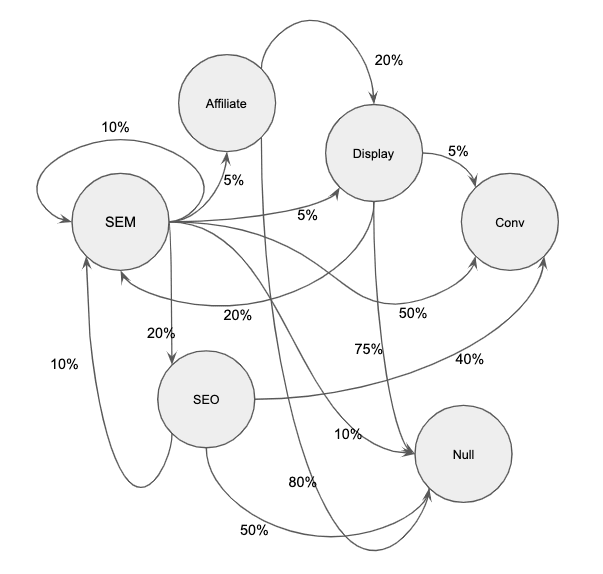
Connect all the nodes
Above we only identified the conditional probabilities for scenario in which our current state was SEM. We now need to go through the same process for every other scenario that is possible to build a networked model that you can follow indefinitely.
Intuition
Now up to this point I've written a lot about the process of defining and constructing a Markov chain but I think at this point it is helpful to explain why I like these models over standard heuristic based attribution models.
Look again at the fully constructed network we have created, but pay special attention to the outbound Display vectors that I've highlighted in blue below.
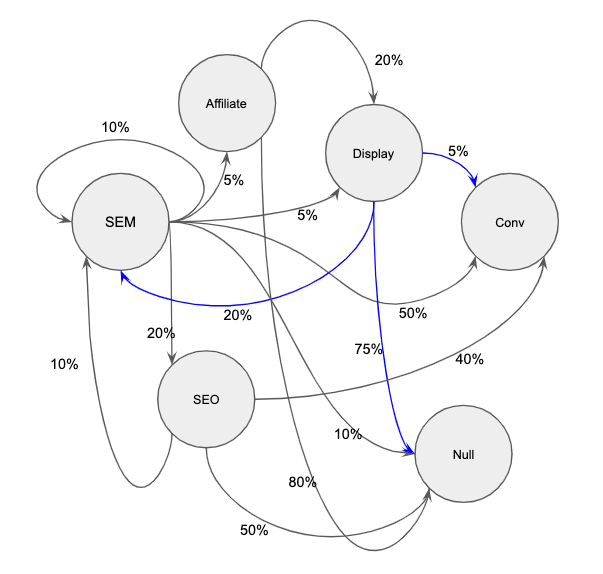
According to the data, we have a high likelihood of not converting at about 75% and only a 5% chance of converting the user. However, that user has a 20% probability of going proceeding to SEM as the next step. And SEM has a 50% chance of converting!
This means that when it comes time to do the "attribution" portion of this model, Display is very likely to increase its share of conversions.
Attributing the Conversions
Now that we have constructed the system that represents our user behavior it's time to use it to re-allocate the total number of conversions that occurred for a period of time.
What I like to do is take the entire system's probability matrix and simulate thousands of runs through the system that end when our simulated user arrives at either conversion or null. This allows us to use a rather small sample to generalize because we can simulate the random walk through the different stages of our system with our prior understanding of the probability of moving from one stage to the next. Since we pass a probability distribution into the mix we are allowing for a bit more variation in our simulation outcomes.
After getting the conversion rates of the system we can simulate what occurs when we remove channels from the system one by one to understand their overall contribution to the whole.
We do this by calculating the removal effect1 which is defined as the percentage of conversions we'd miss out on if a given channel or tactic was removed from the system.
In other words, if we create one new model for each channel where that channel is set to 100% no conversion, we will have a new model that highlights the effect that removing that channel entirely had on the overall system.
Mathematically speaking, we'd be taking the percent difference in the conversion rate of the overall system with a given channel set to NULL against the conversion rate of the overall system. We would do this for each channel. Then we create a weighting for each of them based off of the sum of removal effects and then we could finally then multiply that number by the number of conversions to arrive at the fractionally attributed number of conversions.
If the above paragraph confuses you head over to here and scroll about a third of the way down for a clear removal effect example. I went and made my example system too complicated for me to want to manually write out the the removal effect CVRs.
That's it
Well by now you have a working attribution model that leverages a Markov process for allocating fractions of a conversion to multiple touchpoints! I have also built a proof-of-concept in Python that employs the above methodology to perform Markov model based attribution given a set of touchpoints.2
Cheers!
-
Anderl, Eva and Becker, Ingo and Wangenheim, Florian V. and Schumann, Jan Hendrik, Mapping the Customer Journey: A Graph-Based Framework for Online Attribution Modeling (October 18, 2014). Available at SSRN: https://ssrn.com/abstract=2343077 or http://dx.doi.org/10.2139/ssrn.2343077 ↩

Top comments (0)