Work is hard right now. COVID-19 makes it a challenge to stay focused and motivated. But it was cathartic for me to do some research into how the open source community is responding to the global pandemic.
Since the end of January, the community has contributed to thousands of open source repositories that mention coronavirus or COVID-19. These repositories consist of datasets, models, visualizations, web and mobile applications, and more, and the majority are written in JavaScript and Python.
Previously, we shared information about several open hardware makers helping to stop the spread and suffering caused by the coronavirus. Here, we're sharing four (of many) examples of how the open source software community is responding to coronavirus and COVID-19, with the goal of celebrating the creators and the overall impact the open source community is making on the world right now.
1. CHIME by PennSignals
 CodeForPhilly
/
chime
CodeForPhilly
/
chime
COVID-19 Hospital Impact Model for Epidemics
CHIME
The COVID-19 Hospital Impact Model for Epidemics (penn-chime.phl.io)

Background
The CHIME (COVID-19 Hospital Impact Model for Epidemics) Application is designed to assist hospitals and public health officials with understanding hospital capacity needs as they relate to the COVID pandemic. CHIME enables capacity planning by providing estimates of total daily (i.e. new) and running totals of (i.e. census) inpatient hospitalizations, ICU admissions, and patients requiring ventilation. These estimates are generated using a SIR (Susceptible, Infected, Recovered) model, a standard epidemiological modeling technique. Our model has been validated by several epidemiologists including Michael Z. Levy, PhD, Associate Professor of Epidemiology, Department of Biostatistics, Epidemiology and Informatics at the Perelman School of Medicine.
Originally developed in github.com/pennsignals/chime, active development is now at github.com/CodeForPhilly/chime.
Documentation
Contributing
Join our Code For Philly project or our Slack workspace in…
COVID-19 Hospital Impact Model for Epidemics (CHIME) is an open source application built by data scientists at Penn Medicine at the University of Pennsylvania. The online tool allows hospitals to better understand the impact the virus will have on hospital demand.
Hospital leaders can use CHIME to "get more informed estimates of how many patients will need hospitalization, ICU beds, and mechanical ventilation over the coming days and weeks." A user can input how many patients are currently hospitalized and see, based on other variables, how demand might increase over the coming days.
CHIME is primarily built with Python and uses the pandas open source dependency for much of the underlying data-transformation number-crunching to generate the estimates. Pandas has a relatively robust team and is one of the most commonly used Python libraries for data analysis and, like all open source projects, is highly dependent on users' support for income.
2. Real-time COVID-19 visualization by Locale.ai
localeai
/
covid19-live-visualization
Live visualization of novel corona virus (COVID19) outbreak
COVID19 Visualization
Please note. The data used in the visualization is from an opensource project. We don't guarantee accurate numbers, but we are trying our best to find a reliable source of data.

Project setup
# Clone the project
git clone https://github.com/localeai/covid19-live-visualization.git
# Install dependencies
npm install

# start development server
npm run serve

# generate production build
npm run build
Environment variables
Copy the .env.example file to .env and specify the mentioned variables.
cp .env.example .env
variables
-
VUE_APP_MAPBOX_TOKEN: Mapbox API token. You can get one for yourself from here -
VUE_APP_COVID_API_URL: API which gives the layers data to the webapp. Currently the layers are picked up from periodically generated file from GitHub Repo. Use the static data URL as the API URL.
VUE_APP_COVID_API_URL=https://raw.githubusercontent.com/haxzie/covid19-layers-api/master/data/layers
-
VUE_APP_API_REPO_URL: The GitHub api url for the repo which holds the layers data. Used to pickup the last updated date from the…
Maps that track the number of cases help us visualize the relative scale and spread of COVID-19. Locale.ai created an open source, interactive visualization of all known cases of COVID-19. The map provides live updates with new data as it becomes available.
I find this project especially interesting because the data is retrieved via an open source API created by GitHub user ExpDev07 that queries an open source dataset from John Hopkins University. The John Hopkins dataset (an aggregate of more than a dozen other sources) is currently the most popular COVID19-related project on GitHub. This is the branching nature of open source at its finest!
Locale.ai built the visualization website using Vue.js, a popular framework that allows web developers to create modern web apps. Vue.js was created and continues to be maintained by Evan You, one of the few people who have made a full-time career as an open source maintainer.
3. DXY-COVID-19-Crawler by BlankerL
BlankerL
/
DXY-COVID-19-Crawler
2019新型冠状病毒疫情实时爬虫及API | COVID-19/2019-nCoV Realtime Infection Crawler and API
2019新型冠状病毒疫情实时爬虫


简体中文 | English
本项目为2019新型冠状病毒(COVID-19/2019-nCoV)疫情状况的实时爬虫,数据来源为丁香园。
感谢大家对本项目的支持,为了不让爬虫泛滥占用过多流量,导致其他更有需要的用户无法及时获取到丁香园的数据,请大家减少对爬虫的部署。
我已经开放了一个API接口,其他人如果需要这份数据做其他的可视化,可以直接查看并调用API来获取数据,把丁香园的流量让给更有需要的人。
API:https://lab.isaaclin.cn/nCoV
注:
- API返回中英文城市名称。 更多信息可以关注Issue #61。
- 受限于服务器带宽压力,自2020年3月19日起,API接口
/nCoV/api/overall及/nCoV/api/area不再返回时间序列数据,时间序列数据可以在数据仓库的json文件夹下获取。如果您调用接口时使用了latest=0参数,则需要修改请求,否则无需修改。
本项目遵循MIT开源许可,同时,若引用本API,烦请在您的项目中声明引用。
科研人员
近期多位高校师生与我联系,希望用这些数据做科研之用。然而,并非所有人都熟悉API的使用和JSON数据的处理,因此我部署了一个数据仓库,直接推送大部分统计/数据分析软件可以直接打开的csv文件,希望能够减轻各位的负担。
初衷
衷心感谢各位医疗工作者的付出和努力,苦于没有医学背景,只能通过自己的方式,让大家增强对疫情的关注,让未感染者做好更全面的防护。
项目介绍
本项目每分钟访问并爬取一次数据,储存在MongoDB中,并且保存所有历史数据的更新,希望能够在未来回溯病情时能有所帮助。
爬虫本身并不复杂,可以移步上方API,查看本爬虫能够获取到的所有信息条目。
数据异常
目前发现浙江省/湖北省部分时间序列数据存在数据异常,可能的原因是丁香园数据为人工录入,某些数据可能录入错误,比如某一次爬虫获取的浙江省治愈人数为537人,数分钟后被修改回正常人数。
本项目爬虫仅从丁香园公开的数据中获取并储存数据,并不会对异常值进行判断和处理,因此如果将本数据用作科研目的,请自己对数据进行清洗。同时,我已经在Issue中开放了异常数据反馈通道,可以直接在此问题中反馈潜在的异常数据,我会定期检查并处理。
Reference
- 如果您仅希望通过本API在网页端实现实时数据可视化,可以参考shfshanyue/2019-ncov项目。该项目能够在网页后端每隔30分钟自动运行爬虫,获取最新数据,并渲染在前端直接返回,不会受到API数据返回速度的影响。
- 如果您希望使用R语言对数据进行分析,可以参考pzhaonet/ncovr项目,该项目整合通过GitHub数据仓库/API数据提取两种模式。
Research
所有研究结果均仅作为参考。
Demo
- 网站:https://ncov.deepeye.tech/ 时间序列疫情地图、疫情小区及分析报告。
- pzhaonet/ncov 网站:https://ncov2020.org
- cuihuan/2020_wuhan 可视化效果:http://cuihuan.net/wuhan/news.html
- hack-fang/nCov 可视化效果:http://yiqing.ahusmart.com/
- ohdarling/2019-nCoV-Charts 可视化效果:https://2019-ncov-trends.tk/
- quadpixels/quadpixels.github.io 可视化效果:https://quadpixels.github.io/
- lzxue/yiqingditu 可视化效果:https://lzxue.github.io/yiqingditu/
- covid19viz/covid19viz.github.io 可视化效果:https://covid19viz.github.io/
- biluochun/data-ncov 可视化效果:https://biluochun.github.io/data-ncov/index.html
- Moyck/2019NCOV
- Mistletoer/NCP-historical-data-visualization-2019-nCoV-
捐赠
本项目不需要任何捐赠。
全国各地的医疗资源都处于短缺的状态。如果希望捐赠的人,请移步各个红十字会或者官方认可的捐赠平台,他们能够更加妥善地运用这笔资金,帮助更有需要的人。
祝大家一切都好。
DXY-COVID-19-Crawler was created in January and is one of the earliest responses from the open source community to COVID-19. When the virus was spreading primarily in China, the Chinese medical community was using a site called DXY.cn to report and track cases. To make the information more readily available and usable by others, GitHub user BlankerL wrote a web crawler to systematically collect data from the DXY.cn site and make it available via an API and data warehouse. That data has been used by academic researchers and others to examine trends and visualize the spread of the virus. So far, DXY-COVID-19-Crawler has been starred more than 1,300 times and forked nearly 300 times.
BlankerL wrote the web crawler using Python and a package called Beautiful Soup. Beautiful Soup is an application that allows Python developers to easily scrape information from websites. Beautiful Soup is maintained by Leonard Richardson, who also works full-time as a software architect.
4. City of Tokyo's COVID-19 task force website
tokyo-metropolitan-gov
/
covid19
東京都 新型コロナウイルス感染症対策サイト / Tokyo COVID-19 Task Force website
東京都 新型コロナウイルス感染症対策サイト
![]()
![]()
![]()

日本語 | English | Español | 한국어 | 繁體中文 | 简体中文 | Tiếng Việt | ภาษาไทย | Français
貢献の仕方
Issues にあるいろいろな修正にご協力いただけると嬉しいです。
詳しくは貢献の仕方を御覧ください。
行動原則
詳しくはサイト構築にあたっての行動原則を御覧ください。
ライセンス
本ソフトウェアは、MITライセンスの元提供されています。
このサイトから派生したサイト
このサイトから派生したサイトを御覧ください。
翻訳者向け情報
翻訳をお手伝いいただける方は、How to contribute translationsを御覧ください。
開発者向け情報
開発をお手伝いいただける方は、開発者向け情報を御覧ください。
Many cities around the world have updated their websites with information for their residents about COVID-19. The Tokyo Metropolitan Government created a comprehensive website that "aims to allow Tokyo residents, companies with offices in Tokyo, and visitors to Tokyo to grasp the current situation and take measures and precautions accordingly."
Unlike many other cities, Tokyo decided to open source its site. The project boasts contributions by more than 180 different users, and at least three other cities in Japan (Nagano, Chiba, and Fukuoka City) remixed the site. The project is an example of how cities can better serve their citizens by building openly.
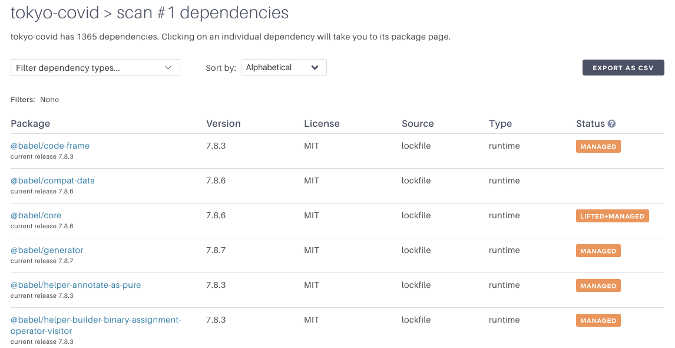
There's an incredible amount of open source technology powering Tokyo's open source website. Using the Tidelift application, I identified 1,365 dependencies used in the project. All of this complexity happens because 38 direct dependencies (i.e., dependencies the developers explicitly decided to use) have dependencies of their own. That said, maintainers of more than a thousand different open source dependencies (including Nuxt.js, Prettier, Babel, Ajv, and more) are in a small way responsible for helping Tokyo share information with their citizens.
Other projects
There are many other important projects being built in the open in response to COVID-19. I am inspired by how the open source community is responding to this pandemic and leveraging other open source technologies to work quickly. The weeks ahead will be difficult, but I know we can continue to find motivation in the open source community.
If you are working on an open source project related to COVID-19, please share it in the comments so we can help spread the word.
This article was originally published on Opensource.com and is licensed under Creative Commons SA-BY 4.0.

Top comments (2)
Hi Jeff. Nice post. I have another project: github.com/LeafyCode/survive-toget...
It's an app to help people in countries where they impose curfew. When they impose curfew, most of the time it's hard for the people to find their daily needs. Sometimes people can't even find water. So this system allows those who are affected to post about their needs so that anyone can have a look at it and help them. It will also show which cities are the most affected.
The other part is that it will allow food or grocery distributors to list their service so people can find who can help them in their city. Let me know what you think.
Hi Jeff, great post! I made a GraphQL API for currents cases about COVID-19.
Repo link: github.com/anajuliabit/covid-graph.... Appreciate stars and contributions :)!