About two years ago, FiveThirtyEight released a database of about 3 million Russian Troll Tweets. Being really excited about the possibility of working with data that was relevant in the news, I forked the repository, where it sat in my GitHub for almost 2 years.
Recently, I've been getting into some data science related projects, and realized I now had the potential to actually do something with this data. Nothing in this post is as impressive as anything that other FiveThirtyEight readers were able to do after a week. However, I think this post could be a good starting point for beginners with some intermediate Python skills to do some cool things with data.
Dependencies
To run the code, you'll need the following 3rd party repositories
matplotlib==3.2.1
wordcloud==1.6.0
Install them by running
pip3 install matplotlib wordcloud
Reading the data
The data I used in this project is available in the fivethirtyeight Git repo at this link: https://github.com/fivethirtyeight/russian-troll-tweets
You can clone the repository and copy the CSV files to a local directory, or fork the repository and modify it within your own GitHub account.
Since the data is in CSV format, I used the CSV library to read the data in. You can read in all the files, or just pick 1 and still get some interesting results. Running on a machine with 8GB of RAM and no GPU, my computer crashed when I tried to read all the files. Not ideal. I read in 5 as a compromise, but may access something with more processing power in the future if I want to expand this project. For me, I put the files I was using in a directory called "data/" and read the files like so:
import os
import csv

host_dir = "data/"
data = list()
for filename in os.listdir(host_dir):
    with open(host_dir + filename, "r") as f:
            raw = csv.DictReader(f, delimiter=",")
            for row in raw:
                data.append(row)
This reads in the tweets as a list of dicts.
Object Oriented Tweets
To make things simpler for me, I created a Tweet class to handle the data. Basically, I created attributes for each dict key of the tweets, so not too complex. This isn't necessary, but the code referenced in these examples will be using this tweet class. It wraps each key-value pair with the following code:
class Tweet:
    def __init__(self, csv_dict):
        self.external_author_id = csv_dict.get("external_author_id")
        self.author = csv_dict.get("author")
        self.content = csv_dict.get("content")
        self.region = csv_dict.get("region")
        self.language = csv_dict.get("language")
        self.publish_date = csv_dict.get("publish_date")
        self.harvested_date = csv_dict.get("harvested_date")
        self.following = csv_dict.get("following")
        self.followers = csv_dict.get("followers")
        self.updates = csv_dict.get("updates")
        self.post_type = csv_dict.get("post_type")
        self.account_type = csv_dict.get("account_type")
        self.retweet = csv_dict.get("retweet")
        self.account_category = csv_dict.get("account_category")
        self.new_june_2018 = csv_dict.get("new_june_2018")
        self.alt_external_id = csv_dict.get("alt_external_id")
        self.tweet_id = csv_dict.get("tweet_id")
        self.article_url = csv_dict.get("article_url")
        self.tco1_step1 = csv_dict.get("tco1_step1")
        self.tco2_step1 = csv_dict.get("tco2_step1")
        self.tco3_step1 = csv_dict.get("tco3_step1")
The attribute descriptions for each key can be found in the fivethirtyeight/russian-troll-tweets repository's ReadMe.
The data is then converted from a list of dicts to a list of Tweet objects with the following list comprehension:
tweets = [Tweet(tweet) for tweet in data]
Analysis Mode
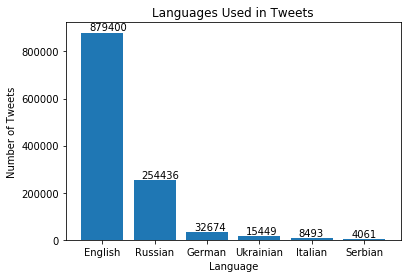
Now that we've loaded and processed the data, we can start doing something useful with it! Let's start by getting some statistics on the languages used in the tweets.
Languages
We can use a Counter object to easily see what languages are used in the tweets.
from collections import Counter
languages = Counter([t.language for t in tweets])
This gives us keys indicating all the languages used in the tweets, and an associated value showing how many tweets were written in that language. We can get a count of all the languages used from the keys:
print(f"\nTotal languages used: {len(languages.keys())}")
And also a frequency plot of the most commonly used languages using the "most_common" function, which returns a list of the n most common occurrences in the Counter.
import matplotlib.pyplot as plt

languages_to_plot = 6
most_common_languages = languages.most_common(languages_to_plot)
language, count = zip(*most_common_languages)
figure, axes = plt.subplots()
axes.bar(language, count)
plt.title("Languages Used in Tweets")
plt.xlabel("Language")
plt.ylabel("Number of Tweets")
for i, v in enumerate(count):  # Used to plot values onto bars; centering imperfect
    plt.text(i - 0.25, v + (max(count) * 0.01), str(v))
plt.show()
This gives us the following plot
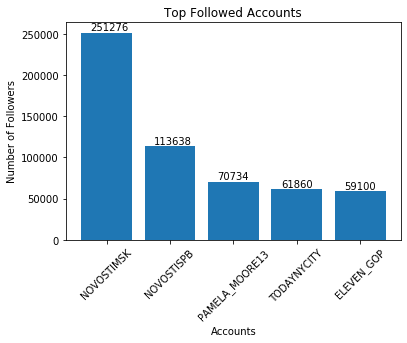
Followers
Let's take a look at how much influence Russian trolls had on Twitter. We can do this by simply sorting the list based on the followers associated with the accounts that sent out each tweet. Because the tweets are stored as Tweet objects, we'll use a lambda function to specify how to sort the tweets. The lambda function will simply return the followers attribute of the tweet cast as an integer, which will allow the sort method to arrange the tweets based on this metric. Note that I set "reverse=True" to get the accounts with the most followers first.
tweets.sort(key=lambda x: int(x.followers), reverse=True)
Now I can just pull the first tweet in the list to find the account with the most followers.
highest_followed = tweets[0]
print(f"\nMax followers reached: {highest_followed.followers}")
I can also use this list to make a bar plot of the troll accounts with the most followers. Instead of using a Counter, I'm just appending the author and their follower count to two separate lists that will have the same index location. Note that I check to make sure the author is not already part of the list before adding them. For example, the top 5 tweets could all be written by the same author, so further perusing is needed.
authors = list()
followers = list()
for t in tweets:
    if len(authors) == 5:
        break
    if t.author not in authors:
        authors.append(t.author)
        followers.append(int(t.followers))
figure, axes = plt.subplots()
axes.bar(authors, followers)
plt.xticks(rotation=45)
plt.title("Top Followed Accounts")
plt.xlabel("Accounts")
plt.ylabel("Number of Followers")
for i, v in enumerate(followers):  # Used to plot values; centering imperfect
    plt.text(i - 0.25, v + (max(followers) * 0.01), str(v))
plt.show()
This gives us the following plot
English language tweets
As you can probably tell by this post, I speak English. Therefore, I'm going to filter out the English language tweets and do some analysis on them. I'll use a filter object to do this. My lambda function will check that the language attribute is equal to "English", and I'll perform this check on each Tweet in the tweets list. Since filter() returns a filter object, I'll cast this into a list by wrapping the operation as a list().
english_tweets = list(filter(lambda x: x.language == "English", tweets))
print(f"\nPerforming analysis on {len(english_tweets)} English tweets")
I want to do some basic analysis on the content of these tweets, so let's first use a list comprehension to get just the tweets themselves.
tweet_content = [t.content for t in english_tweets]
Now, I'm going to split each tweet up by whitespace so that I can get the individual words used in the tweets.
words = list()
for tweet in tweet_content:
    for word in tweet.split(" "):
        words.append(word)
This is great, as I now have a list containing each word used in this list. However, there's probably a bunch of common words in there which I don't really care about, like "a", "an", "the", etc. Also, I need to account for differences in capitalization, and punctuation for words at the end of a tweet. Let's do some data cleaning to account for all these factors.
First, let's put each word in lowercase using a list comprehension
words = [word.lower() for word in words]
Next, let's clean out some words that we don't care about. I can probably find an external library to do this for me, but this project is small enough that I'm just going to create a set of words that I want to purge from my list. I'm using a set over a list because:
Running
for i in set()
is quicker than running
for i in list()
I only need 1 occurrence of each word, so it more closely resembles the formal definition of a set than a list.
Here is the set I'm using in its entirity. You can add or remove words for your own purposes as you see fit, and I'll describe why I left some words in later in this post.
common_words = {
    "-", "~", "&", "a", "an", "the", "on", "to", "is", "for", "and", "of", "you",
    "in", "that", "should", "be", "from", "when", "have", "has", "was", "with", "at",
    "are", "this", "by", "it", "i", "my", "not", "your", "as", "will", "about", "all",
    "who", "they", "are", "his", "out", "but", "up", "our", "like", ":", "\|", "people",
    "he", "just", "new", "me", "get", "can", "more", "so", "what", "i'm", "do", "if",
    "or", "via", "their", "&", "don't", "no", "one", "over", "how", "these", "day", "2",
    "want", "back", "still", "only", "some", "says", }
Let's use this set to filter out those words
words = list(filter(lambda x: x not in common_words, words))
We can purge punctuation with another list comprehension
words = [w.replace("?", "").replace(".", "").replace("!", "") for w in words]
And finally purge out any zero length strings.
words = list(filter(lambda x: len(x) > 0, words))
Now that we have our words, we can do meaningful things with them. Let's make a bar plot of the top 10 words used. We'll filter out hashtags as they have special significance in Twitter.
words_nonhashtags = list(filter(lambda x: x[0] != "#", words))
word_count = Counter(words_nonhashtags)
most_common_words = word_count.most_common(10)
word, word_count_int = zip(*most_common_words)
word = [w.title() for w in word]
figure, axes = plt.subplots()
axes.bar(word, word_count_int)
plt.xticks(rotation=30)
plt.title("Most Frequenty Used Words in English Tweets")
plt.xlabel("Word")
plt.ylabel("Number of Occurrances")
for i, v in enumerate(word_count_int):  # Used to plot values; centering imperfect
    plt.text(i - 0.1, v + (max(word_count_int) * 0.01), str(v))
plt.show()
This gives us the following plot

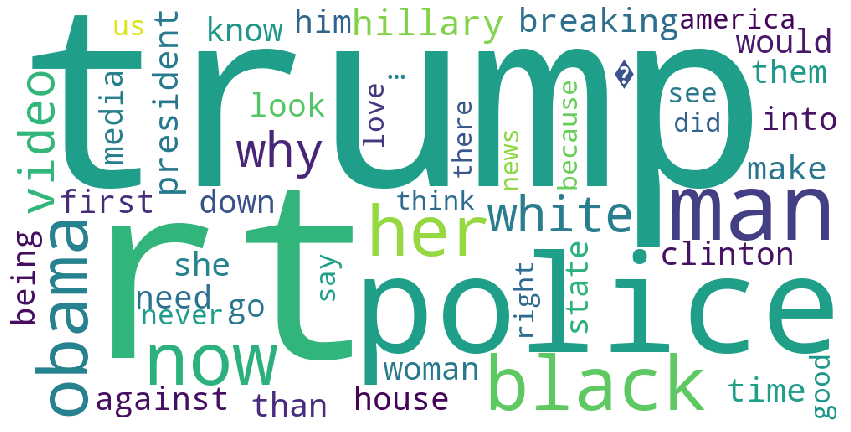
Most of these words have some relation to American politics. Note "Rt", or "RT", is Twitter slang for "Retweet", which usually asks users to retweet their tweet and thus further spread their message. Other words, like "Her" could be innocuous, or could refer to Hillary Clinton, or her "I'm with her" campaign slogan.
Word Cloud Generation
Bar graphs are cool, but word clouds are even cooler! Or outdated and tacky, but whatever, let's make one anyway!
There's a fantastic wordcloud library readily available, so we can pretty quickly and easily spin up a method to present our data in a way that's easy for those non-technically inclined to understand.
The cloud itself is generated with the following code:
import wordcloud
cloud = wordcloud.WordCloud(width = 1000, height = 500, max_words=50, background_color="white").\
generate_from_frequencies(word_count)
In this function, the width and height set give a nice horizontal word cloud for a standard 8.5x11 page. I'm giving the function my entire list of words, but limiting it to 50 with the "max_words" parameter, and I'm setting the background as white with the "background_color" parameter. Then, I pass in my string, or in this case Counter object, to the "generate_from_frequencies" function.
Finally, I plot my word cloud as a regular figure and turn the axis off:
plt.figure(figsize=(15,8))
plt.imshow(cloud)
plt.axis("off")
plt.show()
And I get the following
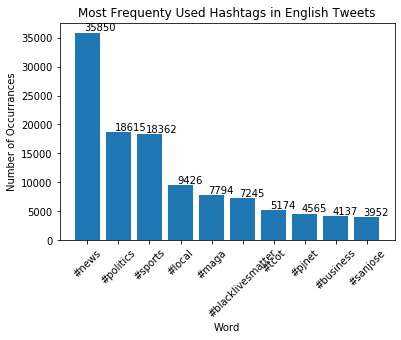
Pretty neat! With hashtags being so important in Twitter, let's do the same thing we did for words in the previous section with the hashtags included in each tweet. Code is very similar, save for the initial filtering step. This code
hashtags = list(filter(lambda x: x[0] == "#", words))
hashtag_count = Counter(hashtags)
most_common_hashtags = hashtag_count.most_common(10)
hashtag, hashtag_count_int = zip(*most_common_hashtags)
figure, axes = plt.subplots()
axes.bar(hashtag, hashtag_count_int)
plt.xticks(rotation=45)
plt.title("Most Frequenty Used Hashtags in English Tweets")
plt.xlabel("Word")
plt.ylabel("Number of Occurrances")
for i, v in enumerate(hashtag_count_int):  # Used to plot values; centering imperfect
    plt.text(i - 0.1, v + (max(hashtag_count_int) * 0.01), str(v))
plt.show()
Gives us this graph
And this code:
hashcloud = wordcloud.WordCloud(width = 1000, height = 500, max_words=50, background_color="white").\
generate_from_frequencies(hashtag_count)
plt.figure(figsize=(15,8))
plt.imshow(hashcloud)
plt.axis("off")
plt.show()
Gives us this word cloud

Conclusion
Although nothing that was done here involved any in-depth data mining, hopefully this gives you a brief overview of how much can be done with 3rd party plotting tools and some intermediate Python functions. I do plan on taking this process a bit further. I'd like to get some insight on why certain words were included, such as determining the context of the tweets. This could be done by utilizing the "account_type" attribute, which would give a description such as "Right wing troll", or, to a more advanced degree, using natural language processing tools.
You can see any future progress I make, and my current Jupyter Notebook, in my Git repository here.

Top comments (0)