Disclaimer ⚠️
This tutorial is by no means advanced, and most of the inspiration and code came from Raluca Nicola's project. Shoutout to them, go check that out as well!🙏🏻 I published this tutorial for a small school project, as I'm learning some new things and putting my own twist on it.
You can view the live version of the globe, it might include some new things as I keep working on it the next few weeks.
Step 1: First things first ✅
Before starting with the globe itself, there are a few preparations you might want to make. To follow this tutorial, make sure you have an already existing Laravel project set up. If you want it to do the exact same way, that is. It is absolutely not a necessity. You can adjust the steps (probably just a few paths and names) so that it makes sense for the tools or frameworks you are using 🦕.
Step 2: Get a clean globe working 🧼
Create a blade file to display the globe in, for example “globe.blade.php”. If you want to use a layout in this file, you should watch out for scripts in the body of the layout file. They might cause the globe not to render, because of the way it is loaded. That’s also why we’ll put the script for the globe in the head section.
Add the following stylesheets and script in the head section:
<link rel="stylesheet" href="https://js.arcgis.com/4.12/esri/themes/light/main.css"/>
<link rel="stylesheet" href="/css/globe.css"/>
<script src="https://js.arcgis.com/4.12/"></script>
Next, add the div section to actually show the globe. Write this in the body of the blade file:
<div id="viewDiv"></div>
Now, create the globe.css file in your public css folder. This should be the content of it:
html,
body,
#viewDiv,
#container {
   padding: 0;
   margin: 0;
   height: 100%;
   width: 100%;
   font-family: "Montserrat", sans-serif;
}

body {
    background: radial-gradient(#5dbcd2, #f4f4f4);
}

#viewDiv canvas {
    filter: saturate(1.2) drop-shadow(0 0 20px white);
}
Now add the base of the script for the globe in your blade file. It should be put in the head section:
<script>
    require([
        "esri/Map",
        "esri/views/SceneView",
        "esri/layers/TileLayer",
        "esri/Basemap"
    ], function(Map, SceneView, TileLayer, Basemap) {

        const basemap = new Basemap({
            baseLayers: [
                new TileLayer({
                    url: "https://server.arcgisonline.com/ArcGIS/rest/services/World_Physical_Map/MapServer"
                })
            ]
        });

        const map = new Map({
            basemap: basemap
        });

        const view = new SceneView({
            container: "viewDiv",
            map: map,
            alphaCompositingEnabled: true,
            qualityProfile: "high",
            camera: {
                position: [20, 22, 25000000],
            },
            environment: {
                background: {
                    type: "color",
                    color: [244, 244, 244, 0]
                },
                starsEnabled: false,
                atmosphereEnabled: false,
                lighting: {
                    directShadowsEnabled: false,
                }
            },
            constraints: {
                altitude: {
                    min: 1000000,
                    max: 25000000
                }
            }
        });
        view.ui.empty("top-left");
    });
</script>
Let me explain some parts of the code
Tilelayer URL 🖽
The URL here defines the way the globe looks. This is the one I’m using, but there’s some others you can use for free. You can find them under properties here: https://developers.arcgis.com/javascript/3/jsapi/esri.basemaps-amd.html
Camera position 📷
The first two values (20, 22) represent the coordinates that the globe loads on. In this case it's focused on Europe (the Netherlands), but you can adjust it to whatever you want.
The third value is the distance that the camera takes from the globe. So if you want it to be extremely zoomed out, the value should be higher. Alternatively, to make it very zoomed in, lower the value.
Stars enabled ✨
The stars are disabled here. The default value is true, so leave this out if you do want stars. You should then probably also remove the environment (background type & color), so that the background appears black. Starry night!
Constraints 💦
These are also altitude values, like the camera position. If you don't want the size to jump when clicking the globe, set the max size to be the same as the camera position. The min size defines how far you can zoom in.
You should now be able to see this!
Step 3: Making it pretty ☁️
Let's add some clouds to make it pop. It'll still be a minimalist look. Get the right png from NASA. 🚀 Add it to your public images directory.
Add graphic, point, and mesh to the start of the script, at require and function, so that it looks like this:
require([
     "esri/Map",
     "esri/views/SceneView",
     "esri/layers/TileLayer",
     "esri/layers/GeoJSONLayer",
     "esri/Basemap",

     "esri/Graphic",
     "esri/geometry/Point",
     "esri/geometry/Mesh"
], function (Map, SceneView, TileLayer, GeoJSONLayer, Basemap, Graphic, Point, Mesh) {
Add the radius of the Earth and offset from the ground for the clouds before defining the basemap:
const R = 6358137;
const offset = 300000;
Next, you will define the sphere for the clouds so that they can show on the globe. You can do this below the "view.ui.empty("top-left")" line:
const cloudsSphere = Mesh.createSphere(new Point({
    x: 0, y: -90, z: -(2 * R + offset)
}), {
    size: 2 * (R + offset),
    material: {
        colorTexture: '/images/clouds-nasa.png',
        doubleSided: false
    },
    densificationFactor: 4
});

cloudsSphere.components[0].shading = "flat";

const clouds = new Graphic({
    geometry: cloudsSphere,
    symbol: {
        type: "mesh-3d",
        symbolLayers: [{ type: "fill" }]
    }
});

view.graphics.add(clouds);
It now looks like this.
Step 4: Adding pinpoints to the globe 📍
Create a GeoJSON file. The geographical features (coordinates) will make it possible for the pins to show up on the right place on the globe. You can have anything you want in the GeoJSON, as long as you include the coordinates. The rest is up to you. Since I want to show the places I've traveled on the globe, so that it links to the photos I took there, I will be adding the following features:
- Name of country
- Fun experience or fact
- Month and year of visit
- Description of the place
- An image URL (my favorite photo of that place)
- A caption for under the image, describing it
- And of course the coordinates. Please note that longitude comes before latitude, instead of the universally agreed upon order of LAT LONG...
Make sure you get the formatting right:
{
  "type": "FeatureCollection",
  "features": [
    {
      "type": "Feature",
      "properties": {
        "name": "Stockholm, Sweden",
        "fact": "Fun experience or fact",
        "visit": "When I visited this place",
        "description": "Description of the place",
        "imageUrl": "Image url address",
        "imageCaption":  "Caption for below the image"
      },
      "geometry": {
        "type": "Point",
        "coordinates": [
          18.06324,
          59.334591
        ]
      }
    }
  ]
}
For more pin points, you just keep repeating the part below, starting with "type": "Feature". I found the formatting extremely annoying, because it doesn't show errors. If you're a newbie like me, I recommend using an online formatter if your code isn't working properly.
Next, you'll be adding the part of the code that makes the GeoJSON show with a popup. Below the clouds code (view.graphics.add(cloud);), add this:
const extremesLayer = new GeoJSONLayer({
  url: "/GeoJSON/visits.geojson",
  elevationInfo: {
    mode: "absolute-height",
    offset: offset,
  },
  renderer: {
    type: "simple",
    symbol: {
      type: "point-3d",
      symbolLayers: [
        {
          type: "icon",
          resource: { href: "/images/dot-circle-regular.svg" },
          size: 15,
        },
      ],
    },
  },
  popupTemplate: {
    title: "{name}",
    content: `
            <div class="popupImage">
              <img src="{imageUrl}" alt="{imageCaption}"/>
            </div>
            <div class="popupImageCaption">{imageCaption}</div>
            <div class="popupDescription">
              <p class="info">
                <span class="esri-icon-favorites"></span> {fact}
              </p>
              <p class="info">
                <span class="esri-icon-map-pin"></span> {visit}
              </p>
              <p class="info">
                <span class="esri-icon-documentation"></span> {description}
              </p>
            </div>
          `,
  },
});

map.layers.add(extremesLayer);
The pin image for the coordinates is one from fontawesome. You can use another one if you want. Esri also had their own types that you can use. The same goes for the symbols in the popup. You can use different ones from Esri, or use something else like fontawesome.
Just right after constraints and above "view.ui.empty("top-left")", add this code for the popup:
popup: {
    dockEnabled: true,
    dockOptions: {
        position: "top-right",
        breakpoint: false,
        buttonEnabled: false
    },
    collapseEnabled: false
},
highlightOptions: {
    color: [255, 255, 255],
    haloOpacity: 0.5
}
Almost done! Add this to your css file:
.esri-popup__content {
    margin: 0;
}

.esri-popup__header-title {
    font-size: 18px;
}

.esri-popup__footer {
    display: none;
}

.esri-feature__main-container .popupImage {
    max-height: 250px;
    overflow: hidden;
}

.popupImage > img {
    width: 100%;
}

.popupImageCaption {
    text-align: center;
    font-size: 0.9em;
    padding: 0.1em 1.5em 0;
}

.popupDescription {
    padding: 2em;
}

p.info {
    margin-bottom: 2em;
    font-size: 1.1em;
}

.popupDescription > p:last-child {
    margin-bottom: 0;
}
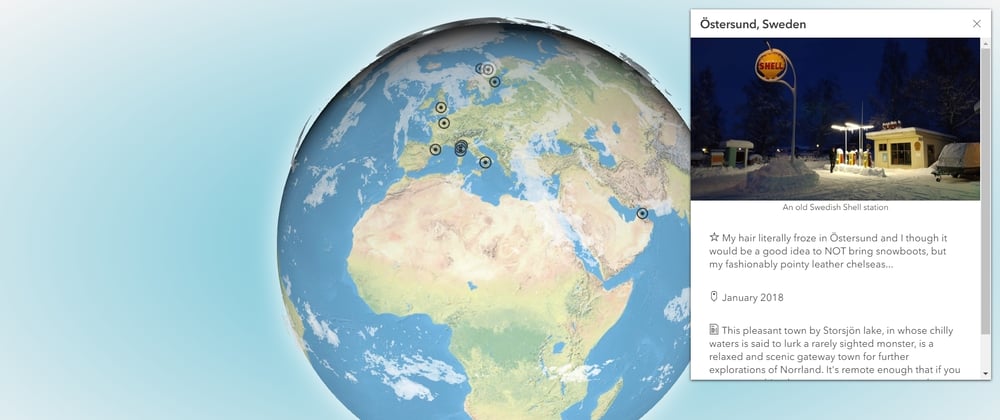
The final product, after clicking the pin! 🥰
Step 5: Make it your own thang 👾
Now it's time to fill up the GeoJSON file with whatever content you want. Have fun!


Top comments (1)
Thanks for the tutorial. But what if I only want a dark, dotted globe, like the one on home page of Github when you're not logged in? Can you help me how to make that?
Btw, what's the vscode theme you're using?