
In this article, we will explore how to use the pandas.cut() method to create number and date intervals for data analysis.
What is pandas.cut()?
Python pandas.cut() is a method in the pandas library that allows you to split a continuous variable into intervals.
This method creates a new categorical variable based on the bins you specify.
The bins can be specified as a list of numbers or as a number of evenly spaced intervals.
This method is commonly used in data analysis to group continuous data into categories or bins. This is useful to create categories for data transformation, time series analysis and to turn data visualizations more informative.
If you want a deeper understanding about those subjects, I recommend the book Python for Data Analysis, a definitive guide on how to deal with data using Python. You can find it here.
Now, let’s move to the first example on how to use pandas.cut() method.
Creating Number Intervals with pandas.cut()
Suppose we have a dataset of student grades, and we want to categorize them into letter grades (A, B, C, D, and F).
We can do this by creating bins based on the grade ranges.

Now, let’s create the bins for the grades:

We want to categorize the grades into the following letter grades: F (below 60), D (60–69), C (70–79), B (80–89), and A (90–100).
We can achieve this by using the pandas.cut() method:

The resulting variable letter_grades is a categorical variable with the letter grades for each grade in the dataset.

You can also sort and group it, if you would like:

Creating Date Intervals with pandas.cut()
Now let’s see how to use pandas.cut() to create date intervals.
Suppose we have a dataset of daily sales, and we want to categorize them into monthly intervals. We can do this by creating bins based on the month ranges.
First, once more, we need to import the pandas library and create a sample dataset:

Now, let’s create the bins for the sales:

And the labels:

We want to categorize the sales into monthly intervals. We can achieve this by using the pandas.cut() method:

And that’s the result:
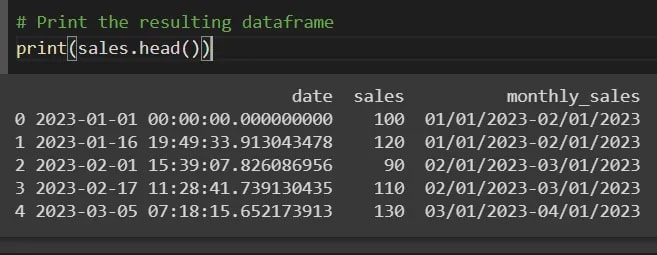
Grouping numbers in intervals is useful to plot concise charts, in this case, using monthly_sales in the X-axis. It turns the chart more compact and easier to read.
This is crucial when presenting data, as explained in Storytelling with Data, the definitive handbook on how to communicate effectively with data.
Find it here.
Conclusion
In conclusion, pandas.cut() is a powerful method in the pandas library that allows you to split a continuous variable into intervals.
By using this method, you can create categorical variables for data analysis and draw insights from raw data.
If you want to learn more about data analysis with Python, I highly recommend the following books:

Top comments (0)