In this post, you'll learn which metrics to keep an eye on to improve your application performance, how AppSignal works, and how to interpret the data it generates. Grab a stroopwafel, make yourself comfy, and let's start!
The Importance of Performance
Most developers understand that it's critical to catch and track exceptions in their application. Some of them use tools such as AppSignal to capture errors and monitor performance, and others set up their own monitoring systems. Either way, you make sure that none of your users experience looking at an error page in the middle of their workflow. E.g. A user is on the checkout page, while their basket is filled to the brim with all sorts of products. However, instead of the checkout page, there's an error message on their screen. The chances are that the user will leave your website and shop somewhere else. While error reporting is generally accepted as a requirement for production sites, performance is often ignored.
In the past few years, several studies have shown that website visitors aren't exactly always the most patient of people. For example, DoubleClick by Google found 53% of mobile visits were abandoned if a page took longer than 3 seconds to load.
These days it's just as important to know how your application is performing in production as it is to know if there are any errors. While errors have a nicely defined way of occurring and handling (an error either happens or it doesn't), the question “what is a good performance” is a lot more challenging to answer.
The answers differ from page to page and also depend on the type of users you have. For example, people are more likely to accept a slower response time for pages with a lot of dynamic content customized to their preferences.
Let's dive into what makes up a typical web response and how each part plays a role in the performance.
A Typical Request
A typical request starts with the browser making a request for a specific page. In the case of Rails/Phoenix, your webserver will accept this request and route it to a controller that handles the request. The controller usually contains one or more database queries that have to be executed in order to retrieve the required data. This data is fed into a templating system that will convert the data to HTML (or JSON).
Several actions are happening during a request that can influence the total response time. Your database is most likely to be the main influencer. Complicated queries on data that isn't indexed results in slow response times.
The templating system can also influence the response time, as complicated loops in the template can increase the duration of a request.
Instrumentation
In 2010 Rails 3 was released, and this included a new feature called ActiveSupport::Notifications. With this system, it was possible to instrument certain parts of your code and track how long it took to execute this code and collect the data for further processing.
This feature allows users to track how long a database query took, or how long it took Rails to process a request. With this information, it's possible to pinpoint performance issues in certain parts of your application such as:
- Database queries,
- View render,
- Framework overhead,
- Controller code, etc.
How AppSignal Hooks Into the Framework(s)
AppSignal listens to the ActiveSupport::Notifications and stores them locally until the request has finished. It then processes the request data (e.g. removal of identifying things such as passwords) and sends this data to our Agent.
The Agent is started when your application starts and is responsible for collecting and aggregating the data for your application and periodically transmits this data to our servers. By aggregating the data in the agent we make sure only to send relevant data to our servers limiting bandwidth usage.
The request data is compiled into several entities such as samples and metrics.
Samples are the result of all data that your application generated during a request. These are all the events a user had to wait for before the server could respond with view data, such as HTML or JSON, and are specific to a single request.
Metrics are aggregated data such as the mean duration of all requests for a certain controller or even globally of your entire application. You cannot identify a single request in this data, but it shows overall performance by using mean, 90th and 95th percentiles. We use this data to generate graphs to track performance over time. We've written a post in the past about how to interpret these aggregated metrics in the post: Don't be mean: Statistical means and percentiles 101 and I highly recommend reading this post to understand what these metrics mean and how they portray your application's performance.
How to Debug a Performance Issue in the AppSignal UI
Now that we have data coming in from your application, it's time to figure out how this data helps you be aware of, and debug performance issues in your application.
Incidents
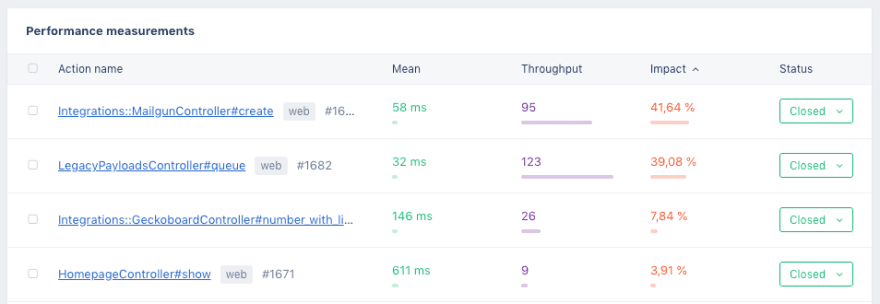
The sample data collected by the Agent will result in what we call “Performance Incidents”. These incidents revolve around a single controller action (or a background job) in your application and show the performance of this controller action.
A nice way to make your application faster is to go through the Incident list and sort your table by “impact”. If you were to make an action faster, Impact is a metric that tells you how much improvement you will have in your application.
In general, it's best to optimize actions that are requested a lot of times and have a high duration. You can spend days optimizing an action that took 2 seconds to respond, but if only a single person was impacted by this query it's probably best to spend time optimizing that 500ms action that was requested 10.000 times in the last hour. Of course, this all depends on what action it was.
Clicking on an incident brings you to the sample page.
Samples
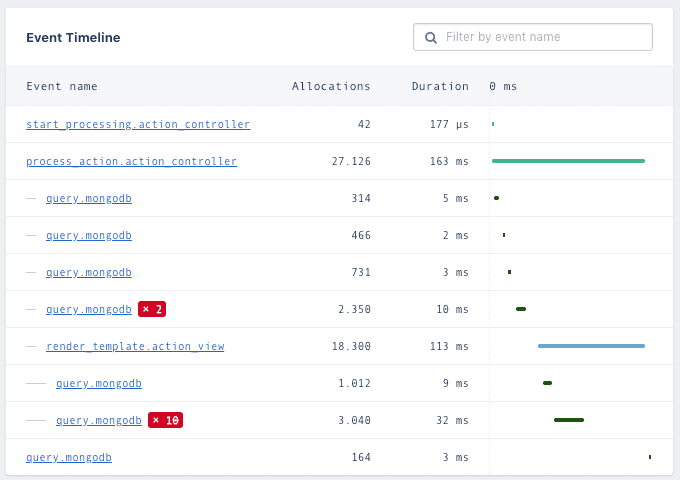
These samples contain request data such as Parameters, Session data, Environment data, and most importantly the “Event tree”.
The event tree is the result of all the Activesupport::Notification data we collected and will show exactly when a database query was executed, the (anonymized) query data, and the query duration.
You can nest Activesupport::Notification calls and the event tree will indent when a nested call is detected. We also detect if a certain event was executed more than once. The most known reason for this happening is an N+1 query. If you see this in your event tree, you can find out what it means and how to fix it in our guide: ActiveRecord performance:
the N+1 queries anti-pattern.
On the incident page, you can set up alerts that will send a notification to your email (or Slack, HipChat, PagerDuty and many others) when we collect a sample that crosses the set threshold (by default this is 200ms). You can also comment on the incident or send it to an issue tracker such as GitHub, GitLab, or Jira.
Graphs
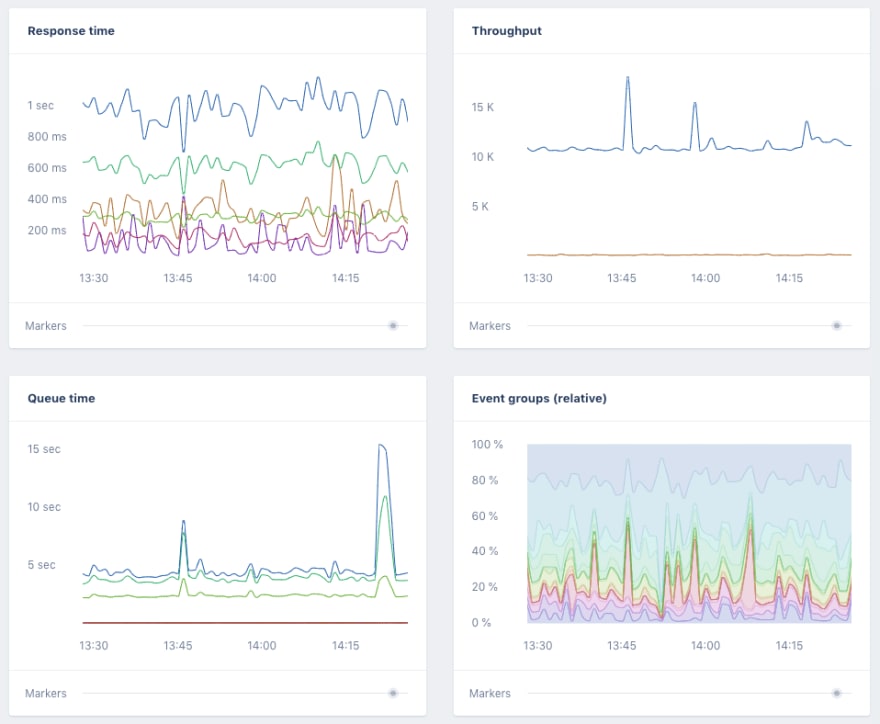
While samples give an excellent deep-dive look into what's happening for a certain controller action (or a background job), this does not provide a good overview of how this controller action (or even your entire application) performs over time. An application might still feel snappy, but the response time could have increased a lot with the release of new features or because of the high application usage.
The “graphs” screen in the performance section uses the collected metrics and will give an overview of the performance of your application. In combination with deploy tracking, you can easily spot performance degradations in your application. Setting the custom date range to 30 or even 90 days will show if your performance is still consistent with what it was a while ago, and this way you can prevent what is called “The boiling frog” of your application.
You can also find “event metric” graphs on this page, but we'll get into those later.
Actions
The “Actions” section of the application is a different view of the collected metrics for each controller action.
The “Actions” table will let you see all the controller actions we've detected in your application, and you can see a summarised throughput and response time for the selected timeframe. This page helps you answer questions such as “how many requests did this action do in the last 30 days”.
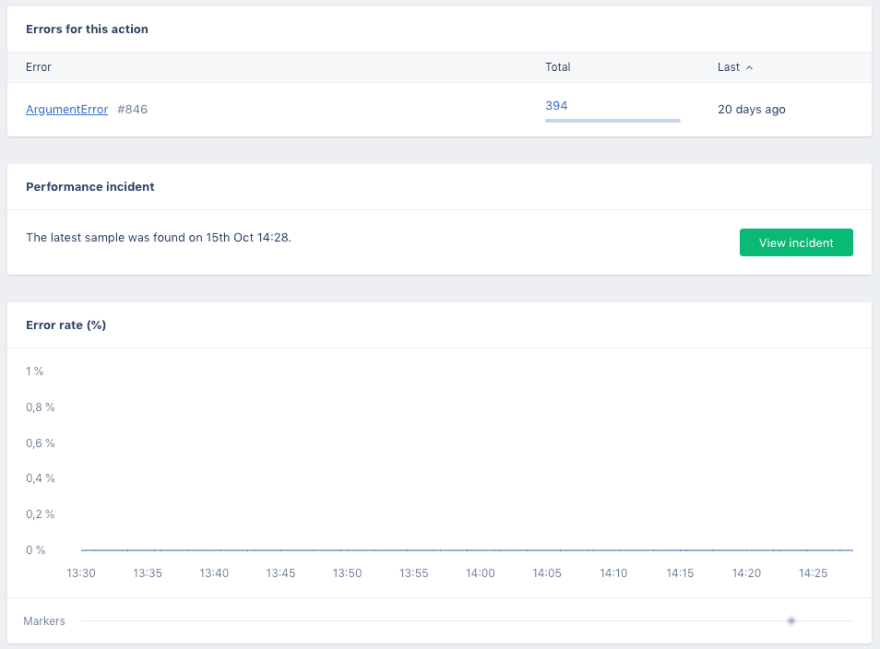
Clicking on an action takes you to the action page with a list of errors and graphs for the error rate, throughput, and response times. This is the same data as in the “graphs” page, but specific to this action. You can see if your latest deploy had any impact on this action's performance.
Event Metrics
Besides metrics for each action, we also collect metrics for each event that was emitted with the ActiveSupport::Notification call. This means we collect the throughput and performance for individual database queries and template render calls.
You can find all the collected events on the “Event metrics” page. The ActiveSupport::Notification naming convention is that of group.event, where the group can be active_record or mongodb for database queries and action_view for template renders.
Other groups on this page can be net_http, active_job or 3rd party instrumentation such as sidekiq or even your own instrumentation calls.
Clicking on a group will take you to a page showing all individual events of that group (e.g. individual database queries or view render calls). In turn, clicking on an individual event will take you to a page that shows metrics for this event and in what controller actions (or background jobs) this event was seen.
As with Incidents, you can also sort these tables by impact to get a nice to-do list for query optimization.
Other Metrics in AppSignal
There are many more metrics that we collect and features we expose in AppSignal to make your application faster, but the ones mentioned above are a good starting point in making your application faster to provide your users with a pleasant browsing experience.
If you are comfortable with these basics you can dive deeper into optimisation by implementing caching, track host metrics or set up alerts with custom metrics and anomaly detection.
You’ve Passed Performance Metrics 101!
Today we went through instrumentation, incidents, we dove deeper into these with samples, and we talked about visualising with graphs. We also went through the basics of events and actions. That concludes performance metrics 101. Yay!
If you have any questions or comments, don't hesitate to contact us.


Top comments (0)