
In the previous installment, we looked at the source code's literal text shape to quickly estimate code "legacyness". FORTRAN source code prior to Fortran 90 has a very distinct shape due to the historical use of punched cards for code input. Knowing the language evolved toward an ALGOL-like block structure, we can even differentiate F66 from F77 just by looking at code shape. While that allows us to make a quick qualitative assessment of individual files, we often want to quickly assess the complexity of a complete project.
Listings and Trees
A very quick way to get information about a project is simply to look at the project's directory listing. For Castlequest, we see:
$ dir /s /O-s
 Volume in drive C is OS
 Volume Serial Number is 569C-2024

 Directory of C:\Users\apthorpe\Documents\git_projects\appraiser\tests\data\Castlequest_F66

04/12/2021  07:57         6,847,398 castlequest.pdf
04/12/2021  07:57           341,671 castlequest.ocr.txt
09/17/2021  10:40             3,384 WizTree_20210917103835.csv
08/07/2021  10:56             2,179 README.md
04/12/2021  07:57               188 LICENSE
08/20/2021  07:39    <DIR>          src
09/17/2021  10:38    <DIR>          ..
09/17/2021  10:38    <DIR>          .
               5 File(s)      7,194,820 bytes

 Directory of C:\Users\apthorpe\Documents\git_projects\appraiser\tests\data\Castlequest_F66\src

08/07/2021  10:56            64,190 main.f
08/07/2021  10:56            20,196 long.dat
08/07/2021  10:56             6,663 move.f
08/07/2021  10:56             6,499 init.f
08/07/2021  10:56             4,347 des.f
08/07/2021  10:56             4,330 help.f
08/07/2021  10:56             3,971 input.f
08/07/2021  10:56             3,950 short.dat
08/07/2021  10:56             2,918 invent.f
08/07/2021  10:56             2,889 object.dat
08/07/2021  10:56             1,648 fread.f
08/07/2021  10:56             1,598 hint.dat
08/07/2021  10:56             1,465 inst.dat
08/07/2021  10:56             1,369 wwolf.f
08/07/2021  10:56             1,238 savres.f
08/07/2021  10:56             1,026 ggnome.f
08/07/2021  10:56               913 adscor.f
08/07/2021  10:56               653 obj.f
08/07/2021  10:56               423 Makefile
08/07/2021  10:56               413 yorn.f
08/07/2021  10:56               243 rstart.f
08/07/2021  10:56               178 isig.f
08/07/2021  10:56               126 asa.py
08/20/2021  07:39    <DIR>          .
08/20/2021  07:39    <DIR>          ..
              23 File(s)        131,246 bytes

     Total Files Listed:
              28 File(s)      7,326,066 bytes
               5 Dir(s)  617,442,611,200 bytes free
This is from using the Windows command shell; Linux and MacOS shell users can get about the same information with ls -R -S -s -h -1. The selected options are recursive, ordered by decreasing size in human-readable units, single column.
It's not the greatest display but it's simple. Source files are under ./src, the largest one is main.f followed by move.f down to isig.f. This may be adequate for small projects but starts showing its limits after about half a screen of output.
A slightly better command line tool is tree which as the name suggests displays the directory structure as a tree. Windows' tree.com is not nearly as useful as the Unix version. Here we see the files arranged in a tree structure ordered by decreasing file size:
$ c:\tools\msys64\usr\bin\tree.exe -h --sort=size
.
├── [6.5M]  castlequest.pdf
├── [334K]  castlequest.ocr.txt
├── [3.3K]  WizTree_20210917103835.csv
├── [2.1K]  README.md
├── [ 188]  LICENSE
└── [   0]  src
    ├── [ 63K]  main.f
    ├── [ 20K]  long.dat
    ├── [6.5K]  move.f
    ├── [6.3K]  init.f
    ├── [4.2K]  des.f
    ├── [4.2K]  help.f
    ├── [3.9K]  input.f
    ├── [3.9K]  short.dat
    ├── [2.8K]  invent.f
    ├── [2.8K]  object.dat
    ├── [1.6K]  fread.f
    ├── [1.6K]  hint.dat
    ├── [1.4K]  inst.dat
    ├── [1.3K]  wwolf.f
    ├── [1.2K]  savres.f
    ├── [1.0K]  ggnome.f
    ├── [ 913]  adscor.f
    ├── [ 653]  obj.f
    ├── [ 423]  Makefile
    ├── [ 413]  yorn.f
    ├── [ 243]  rstart.f
    ├── [ 178]  isig.f
    └── [ 126]  asa.py

1 directory, 28 files
Again, only slightly better than the flat display of dir or ls and really only suitable for small projects. Beyond a screenful of output, it's difficult to grasp the entirety of a project, its structure, size, and composition. The terminal interface is limiting; let's look for a graphical tool.
Treemaps
We'd like to have a single image which displays the fraction of project space occupied by each file and directory over the entire project, ideally with some means of differentiating code from data from infrastructure, etc.
Introducing the treemap, a way of displaying hierarchical information as a two-dimensional map. Elements and groups are represented as rectangles, hierarchy is displayed using arrangement / layout, and rectangle size and color communicate properties about each element. Here is the full Castlequest project viewed as a treemap:
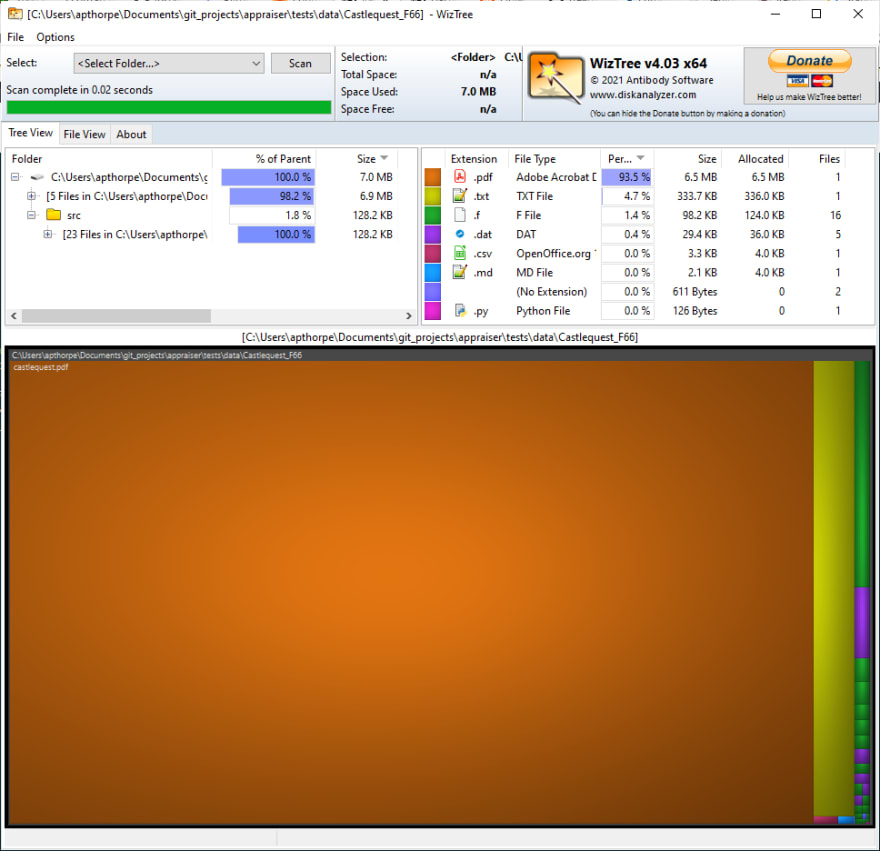
The area of a rectangle corresponds to file or directory size. Files are represented as individual rectangles which may be grouped into larger rectangles to show the directory hierarchy. Color indicates file type (extension).
We immediately see that the bulk of the project's size is taken up by the PDF scans of the source code. This is not terribly useful but it does indicate that the interesting parts of the project take up only a small amount of space in the project.
Ideally there would be a way to emphasize only the types of files we're interested in, but common treemap visualizers have very limited filtering capabilities. The primary use case of this class of utility is to quickly identify large files to help with filesystem maintenance. The example here is taken from WizTree on Windows but there are a number of free and commercial tools available for each platform. SequoiaView, KDirStat/QDirStat, WinDirStat, and Disk Inventory X all provide roughly the same functionality.
This is a good starting point; let's move on to looking specifically at Castlequest's src directory:
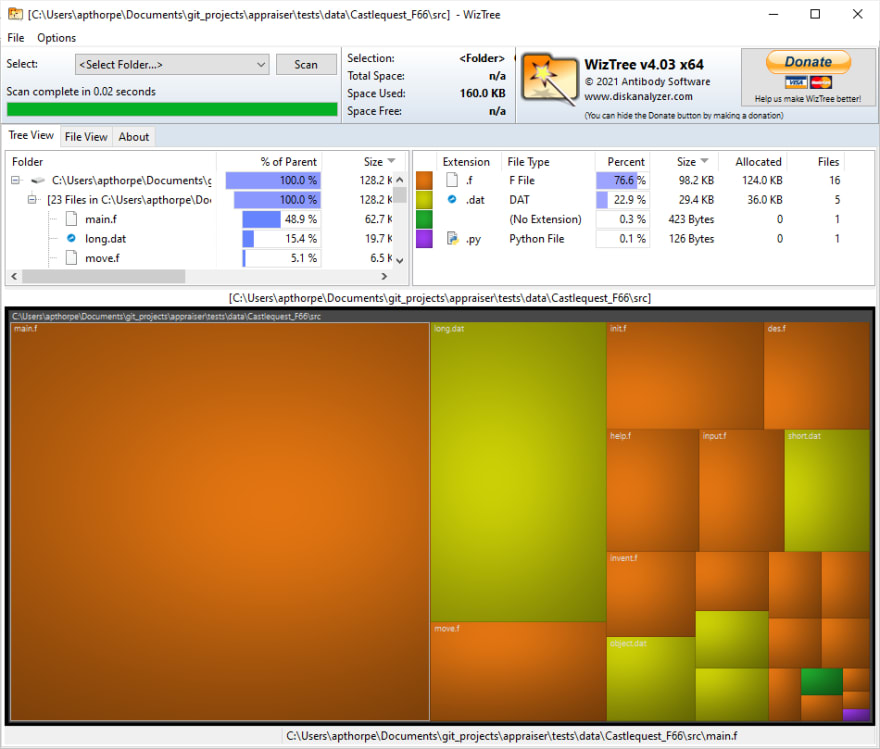
One file (main.f) is obviously much larger than all the other source files. Knowing nothing else about the project, we can guess that most of our modernization effort will be focused on that single file. We also see a number of data files associated with the project which implies there are file operations and data structures within the source code to manage this data. The size of the data files may imply the amount of static storage (RAM) or file activity the code requires. Remember that we're looking at the whole project, not just source code.
This abstraction comes with a cost. While we gain an overall impression of project size and composition, some useful detail is obscured such as file and directory names. Using WizTree interactively we can see full path name and both allocated and actual file size. That's not apparent just from screenshots of the application. Still, we might like visual indication of the dialect of Fortran used in a file, the number and size of program units (e.g. functions, subroutines) in each file, and other metrics like number and severity of uncomfortable legacy constructs.
It's unlikely an existing tool does everything we might want but depending on how useful we find this analysis, we might put some effort toward extending these utilities or writing a custom visualizer as was done for displaying code shape.
Conveniently, treemap generation is not terribly complex; the original papers describing the algorithms for squarifying and cushioning treemaps are readily available. Further, treemaps have been used to visualize a wide variety of hierarchical data beyond filesystem contents. There are libraries in a number of languages which simplify treemap creation, for example the Python library squarify generates treemap images using the Matplotlib plotting library.
Visualizing Other Projects
Castlequest is a relatively small and simple project. A slightly more complex project is NASA's CEA2 (Chemical Equilibrium with Applications) which performs literal rocket science.

Source code is shown in yellow; we see it's a small fraction of the chemical transport and thermodynamic datafiles and example data. We also see source code spread over a few directories. CEA2 consists of an analytical package and several utilities for managing its physical property databases.
A larger legacy FORTRAN project is NASTRAN-95, a finite element structural analysis code (again from NASA) that consists of almost 2000 individual source files as well as substantial example case input and output files.
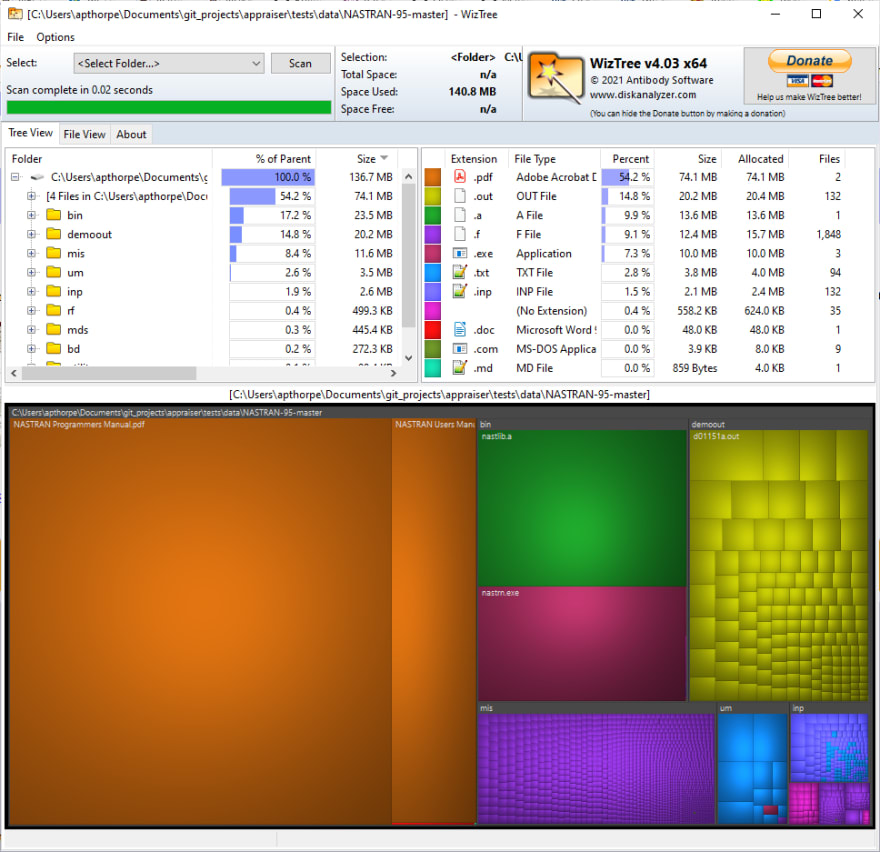
Here we see a very clear organization of source and data. Source files are rather uniform in size compared to Castlequest, suggesting that NASTRAN is more evenly decomposed. Individual routines may be more focused and clearer than what we expect of Castlequest's large main program.
Summary
This sort of visualization is not necessary for refactoring but it helps with project estimation especially when a quick estimate is needed. Treemaps are an interesting way of visualizing data. Most standalone treemapping tools are aimed at filesystem maintenance but the general technique is useful for visualizing any form of hierarchical data.
Image Credits:
Cushion photo courtesy of ~riley, CC BY-SA 3.0, via Wikimedia Commons

Top comments (0)