 MongoDB's aggregation framework is powerful yet often misunderstood. Whether you're prepping for interviews, building analytics, or learning data science workflows, mastering aggregation is essential. Below are 10 real-world problems, complete with queries and explanations, using a sample dataset of users.
Sample MongoDB Collection: users
[
  { "name": "Alice", "age": 28, "country": "USA", "gender": "female", "signupDate": "2023-12-20T10:15:00Z" },
  { "name": "Bob", "age": 34, "country": "Canada", "gender": "male", "signupDate": "2024-01-15T12:00:00Z" },
  { "name": "Charlie", "age": 22, "country": "India", "gender": "male", "signupDate": "2024-02-05T09:45:00Z" },
  { "name": "Diana", "age": 30, "country": "USA", "gender": "female", "signupDate": "2024-03-01T08:30:00Z" },
  { "name": "Eve", "age": 29, "country": "India", "gender": "female", "signupDate": "2024-01-25T11:20:00Z" },
  { "name": "Frank", "age": 40, "country": "Canada", "gender": "male", "signupDate": "2024-02-10T14:50:00Z" },
  { "name": "Grace", "age": 19, "country": "USA", "gender": "female", "signupDate": "2024-03-10T07:10:00Z" },
  { "name": "Harry", "age": 31, "country": "UK", "gender": "male", "signupDate": "2024-03-12T17:40:00Z" },
  { "name": "Ivy", "age": 27, "country": "India", "gender": "female", "signupDate": "2024-01-01T06:00:00Z" },
  { "name": "Jack", "age": 36, "country": "Canada", "gender": "male", "signupDate": "2024-02-20T18:15:00Z" }
]
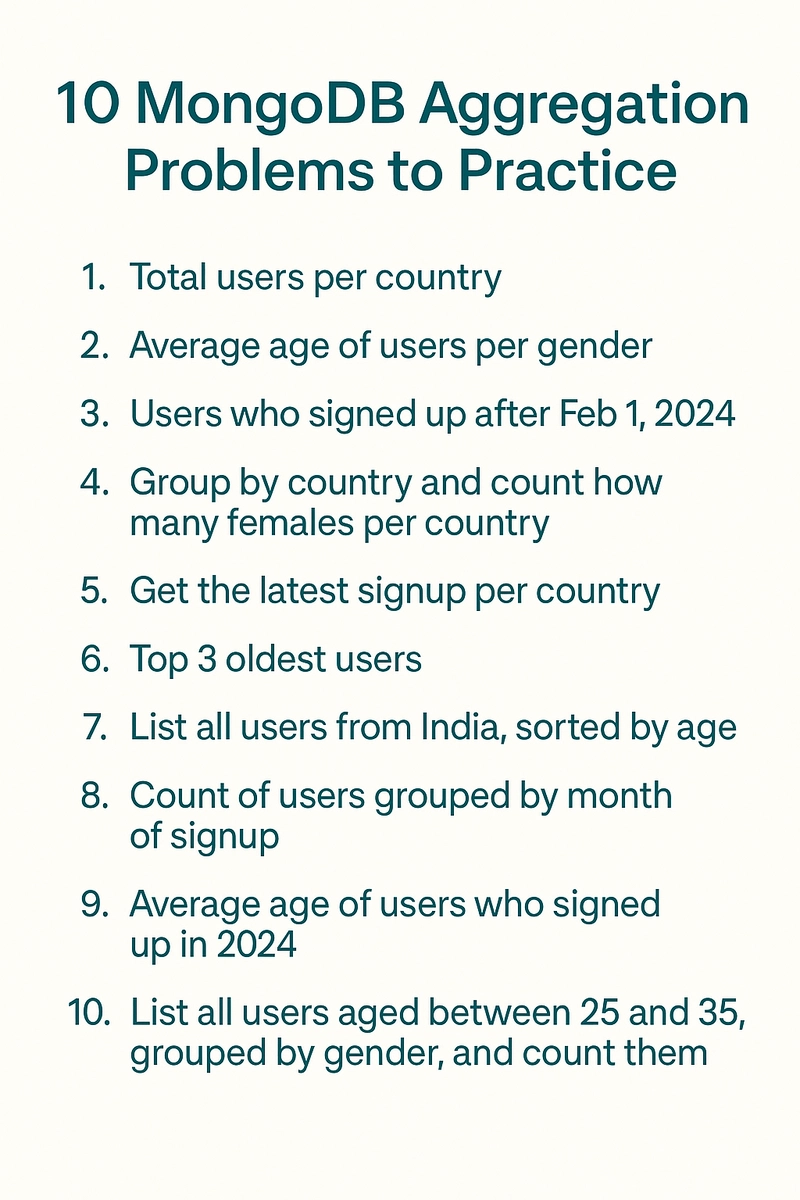
1. Count of Users by Country
[
  {
    $group: {
      _id: "$country",
      totalUsers: { $sum: 1 }
    }
  }
]
2. Average Age by Gender
[
  {
    $group: {
      _id: "$gender",
      averageAge: { $avg: "$age" }
    }
  }
]
3. Users Signed Up After February 1, 2024
[
  {
    $addFields: {
      signupDateConverted: {
        $toDate: "$signupDate"
      }
    }
  },
  {
    $match: {
      signupDateConverted: {
        $gte: ISODate("2024-02-01T00:00:00Z")
      }
    }
  }
]
4. Count of Female Users by Country
[
  { $match: { gender: "female" } },
  {
    $group: {
      _id: "$country",
      femalePerCountry: { $sum: 1 }
    }
  }
]
5. Group by Country After Sorting by Signup Date (Descending)
[
  { $sort: { signupDate: -1 } },
  {
    $group: {
      _id: "$country"
    }
  }
]
6. Get the 3 Earliest Signups
[
  { $sort: { signupDate: 1 } },
  { $limit: 3 }
]
7. All Indian Users Sorted by Age Descending
[
  { $match: { country: "India" } },
  { $sort: { age: -1 } }
]
8. Count of Users Grouped by Month of Signup
[
  {
    $project: {
      monthYear: {
        $dateToString: {
          format: "%Y-%m",
          date: { $toDate: "$signupDate" }
        }
      }
    }
  },
  {
    $group: {
      _id: "$monthYear",
      userCount: { $sum: 1 }
    }
  },
  { $sort: { _id: 1 } }
]
9. Average Age of Users Signed Up in 2024
[
  {
    $project: {
      year: {
        $dateToString: {
          format: "%Y",
          date: { $toDate: "$signupDate" }
        }
      },
      age: 1,
      name: 1,
      signupDate: 1
    }
  },
  { $match: { year: "2024" } },
  {
    $group: {
      _id: "$year",
      avgAge: { $avg: "$age" }
    }
  }
]
10. Count of Users Aged 25 to 35 Grouped by Gender
[
  {
    $match: {
      age: { $gte: 25, $lte: 35 }
    }
  },
  {
    $group: {
      _id: "$gender",
      count: { $sum: 1 }
    }
  }
]
MongoDB aggregations are incredibly versatile. From basic groupings to complex date manipulations, they can power dashboards, reports, and analytics. Bookmark this post for reference and practice daily!
Happy querying! 🚀

Top comments (0)