As with previous years, the goal of this year’s survey is simple. To discover current knowledge and usage levels of common front-end tools across our industry.
So which tools will be top of the pile in 2019?
➡️ Take this year’s survey now
I really appreciate you taking the time to take part. Every response helps to provide a more representative sample of the front-end community.
A recap of last year’s results
Last year, 5,461 front-end developers took the time to answer 24 questions on a variety of front-end tools.
So what were the main trends that could be seen in these responses?
React and Vue.js usage grew rapidly
Respondents were asked three questions concerning JavaScript libraries and frameworks. These related to their knowledge and usage of these tools as well as if they considered any of them essential when working on front-end projects.
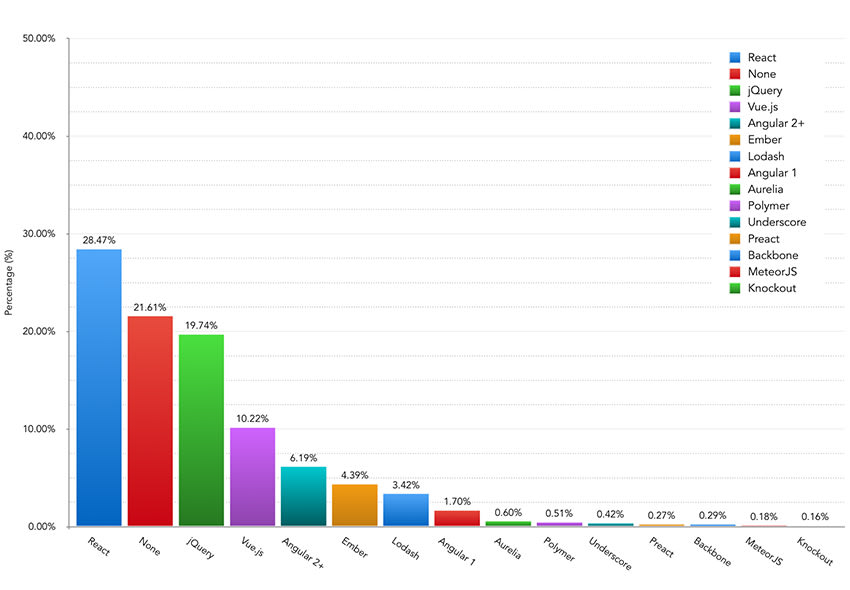
React and Vue.js made large gains across all of these areas. In fact, in a change from the previous set of results, React was considered the most essential tool in this category for the first time — knocking jQuery off the top spot–with almost a third of respondents replying as such (28.47%).
jQuery fell to third place in this category, behind those who said that they didn’t consider any library or framework as essential. Vue.js came fourth, jumping from 3.01% in the 2016 results to 10.21% in 2018.
In terms of knowledge levels across these tools, jQuery was still the tool that most respondents felt comfortable using (79.73%). However, this figure showed a percentage drop for the first time, falling almost 7% from the previous survey. In comparison, 40.43% of respondents said the same about React, which represented a rise of 12.30% in the same time.
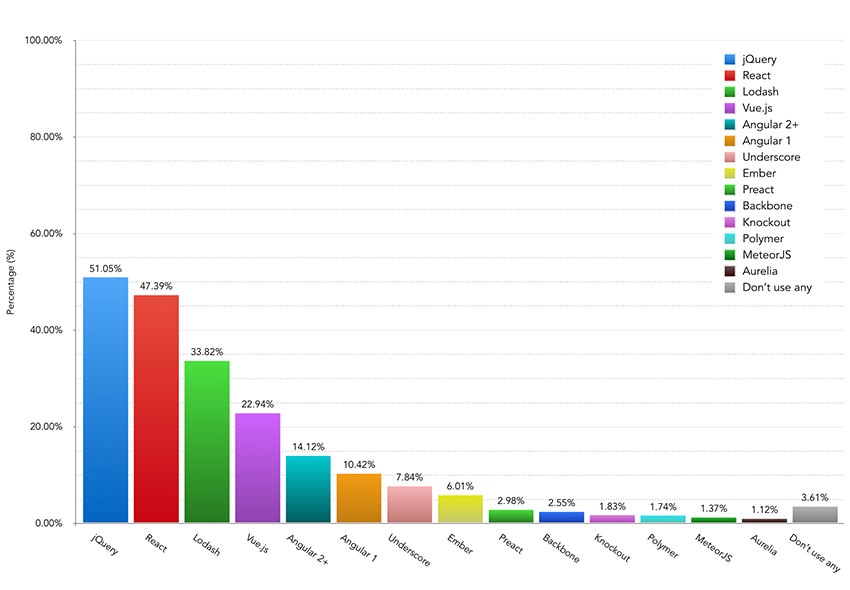
Usage figures showed a similar trend, with React and Vue.js growing to 47.39% and 22.94% respectively, when respondents were asked which frameworks they currently use most frequently on projects. This represented a gain of 10.48% and 13.59% from their usage figures in the 2016 survey. jQuery, in contrast, saw a fall in usage of 19.20%, although it did narrowly stay top in this category, with 51.05% saying they still frequently used it.
Overall, the trend across these questions clearly indicated that jQuery usage looked like it was waning slightly, with developers considering it a less important tool in their workflows. On the flip-side, React and Vue.js usage and knowledge levels grew rapidly in the same period.
CSS-in-JS tools saw steady growth
The number of developers that said they felt comfortable using a CSS-in-JS solution almost doubled to 19.92% in last year’s results. Clearly, more developers have been looking at tools which can help them to encapsulate their styles when building components.
Although this only represented a fifth of respondents, it shows an upward trend that will be worth keeping an eye on in this year’s results.
CSS Grid adoption made good progress
CSS layout features have made giant leaps over the last couple of years. You’d need to have been living under a rock to miss the barrage of news and tutorials relating to flexbox and CSS Grid.
Last year’s results showed that these features were showing good adoption among developers. A large majority (67.59%) said that they felt comfortable using flexbox. In comparison, 18.48% said the same with respect to CSS Grid, which is a respectable amount considering it’s been supported for far less time than flexbox. This percentage rose to 62.41% of respondents when including those that said they had at least a little bit of experience using CSS Grid.
See the full results
If you’re interested in going through all the data from last year’s survey, check out the full 2018 results article.
It’ll be fascinating to see how all of the above trends and figures have progressed another 12 months on.
What’s new for this year?
While trying to keep the survey succinct, we’ve added a couple of new questions after considering feedback from respondents last year.
With the rise of CSS-in-JS tools — as shown in the 2018 results — this year’s survey now has a question specifically related to this category of tools.
In addition, there are new questions aimed at discovering which performance and accessibility tools and features are currently being used by developers.
After a number of requests last year, I’ll also be releasing a collated (anonymised) dataset of the survey responses. This will include the response data from the previous three surveys as well.
Take part in this year’s survey
So that’s enough from me — go ahead and take this year’s survey!
The survey will close at the end of April, with the results written up shortly after. If you’d like to know when this happens, follow me on Twitter or leave your email at the end of the survey. You’ll then receive a link to the results articles once they are published.


Top comments (0)