
In the realm of system monitoring and observability, logs present two prominent challenges: comprehensibility and cost-efficiency. When a system is operational, sifting through an abundance of collected logs to locate pertinent information can be an arduous task. The sheer volume of logs often generates excessive noise, making it difficult to discern meaningful signals. Numerous vendors offer services to extract valuable insights from log data, albeit at a considerable expense. The processing and storage of logs come with a significant price tag.
As an alternative, metrics emerge as a crucial component in the observability toolkit that many teams resort to. By focusing on quantitative measurements, the advantage of metrics lies in their lower cost compared to dealing with copious amounts of textual data. Additionally, metrics offer a concise and comprehensive understanding of system performance.
Nevertheless, utilizing metrics poses its own set of challenges for developers, who must navigate the following obstacles:
- Determining which metrics to track and selecting the appropriate metric type, such as counters or histograms, often presents a dilemma.
- Grappling with the intricacies of composing queries in PromQL or similar query languages to obtain the desired data can be a daunting task.
- Ensuring that the retrieved data effectively addresses the intended question requires meticulous verification.
These hurdles underscore the difficulties developers encounter when leveraging metrics for system monitoring and analysis.
Autometrics offers a simplified approach to enhance code-level observability by implementing decorators and wrappers at the function level. This framework employs standardized metric names and a consistent tagging or labeling scheme for metrics.
Currently, Autometrics utilizes three essential metrics:
-
function.calls.count: This counter metric effectively monitors the rate of requests and errors. -
function.calls.duration: A histogram metric designed to track latency, providing insights into performance. - (Optional)
function.calls.concurrent: This gauge metric, if utilized, enables the tracking of concurrent requests, offering valuable concurrency-related information.
Additionally, Autometrics includes the following labels automatically for all three metrics:
-
function: This label identifies the specific function being monitored. -
module: This label specifies the module associated with the function.
Furthermore, for the function.calls.count metric, the following labels are also incorporated:
-
caller: This label denotes the caller of the function. -
result: This label captures the outcome or result of the function.
There are a lot of useful features supported to help build a whole metrics based observability platform.
Demo time
Let us instrument a simple python flask application for rolling dice. This application runs on localhost and is exposed on port 23456
Pre-requistes
- Install and configure prometheus
❯ cat prometheus.yml
scrape_configs:
  - job_name: my-app
    metrics_path: /metrics
    static_configs:
    # host.docker.internal is to refer the localhost which will run the flask app
      - targets: ['host.docker.internal:23456']
    scrape_interval: 20s

❯ docker run \
    --name=prometheus \
    -d \
    -p 9090:9090 \
    -v $(pwd)/prometheus.yml:/etc/prometheus/prometheus.yml \
    prom/prometheus

❯ curl localhost:9090
<a href="/graph">Found</a>.
- Create a sample flask application
❯ cat app.py
from flask import Flask, jsonify, Response
import random

app = Flask(__name__)

@app.route('/')
def home():
    return 'Welcome to the Dice Rolling API!'

@app.route('/roll_dice')
@autometrics
def roll_dice():
    roll = random.randint(1, 6)
    response = {
        'roll': roll
    }
    return jsonify(response)

if __name__ == '__main__':
    app.run(host='0.0.0.0', port=23456, debug=True)
Instrumentation for a flask application
Install the library
pip install autometricsCreate a
.envfile pointing to the prometheus endpoint
❯ cat .env
PROMETHEUS_URL=http://localhost:9090/
- Update the script to add
@autometricsdecorators and expose the metrics at/metrics
❯ cat app.py
from flask import Flask, jsonify, Response
import random

from autometrics import autometrics
from prometheus_client import generate_latest

app = Flask(__name__)

@app.route('/')
def home():
    """
    default route
    """
    return 'Welcome to the Dice Rolling API!'

# order of decorators is important
@app.route('/roll_dice')
@autometrics
def roll_dice():
    """
    business logic
    """
    roll = random.randint(1, 6)
    response = {
        'roll': roll
    }
    return jsonify(response)

@app.get("/metrics")
def metrics():
    """
    prometheus metrics for scraping
    """
    return Response(generate_latest())


@app.route('/ping')
@autometrics
def pinger():
    """
    health check
    """
    return {'message': 'pong'}

if __name__ == '__main__':
    app.run(host='0.0.0.0', port=23456, debug=True)
- Check for the auto-generated help and exposed metrics (VSCode will show it on hover)
❯ python
Python 3.11.3 (main, Apr  7 2023, 20:13:31) [Clang 14.0.0 (clang-1400.0.29.202)] on darwin
Type "help", "copyright", "credits" or "license" for more information.
>>> import app.py
Traceback (most recent call last):
  File "<stdin>", line 1, in <module>
ModuleNotFoundError: No module named 'app.py'; 'app' is not a package
>>> import app
# >>> print(app.roll_dice.__doc__)
Prometheus Query URLs for Function - roll_dice and Module - app:

Request rate URL : http://localhost:9090/graph?g0.expr=sum%20by%20%28function%2C%20module%2C%20commit%2C%20version%29%20%28rate%20%28function_calls_count_total%7Bfunction%3D%22roll_dice%22%2Cmodule%3D%22app%22%7D%5B5m%5D%29%20%2A%20on%20%28instance%2C%20job%29%20group_left%28version%2C%20commit%29%20%28last_over_time%28build_info%5B1s%5D%29%20or%20on%20%28instance%2C%20job%29%20up%29%29&g0.tab=0

Latency URL : http://localhost:9090/graph?g0.expr=sum%20by%20%28le%2C%20function%2C%20module%2C%20commit%2C%20version%29%20%28rate%28function_calls_duration_bucket%7Bfunction%3D%22roll_dice%22%2Cmodule%3D%22app%22%7D%5B5m%5D%29%20%2A%20on%20%28instance%2C%20job%29%20group_left%28version%2C%20commit%29%20%28last_over_time%28build_info%5B1s%5D%29%20or%20on%20%28instance%2C%20job%29%20up%29%29&g0.tab=0

Error Ratio URL : http://localhost:9090/graph?g0.expr=sum%20by%20%28function%2C%20module%2C%20commit%2C%20version%29%20%28rate%20%28function_calls_count_total%7Bfunction%3D%22roll_dice%22%2Cmodule%3D%22app%22%2C%20result%3D%22error%22%7D%5B5m%5D%29%20%2A%20on%20%28instance%2C%20job%29%20group_left%28version%2C%20commit%29%20%28last_over_time%28build_info%5B1s%5D%29%20or%20on%20%28instance%2C%20job%29%20up%29%29%20/%20sum%20by%20%28function%2C%20module%2C%20commit%2C%20version%29%20%28rate%20%28function_calls_count_total%7Bfunction%3D%22roll_dice%22%2Cmodule%3D%22app%22%7D%5B5m%5D%29%20%2A%20on%20%28instance%2C%20job%29%20group_left%28version%2C%20commit%29%20%28last_over_time%28build_info%5B1s%5D%29%20or%20on%20%28instance%2C%20job%29%20up%29%29&g0.tab=0

-------------------------------------------
- Run the application, generate some load
❯ for i in $(seq 1 10); do
http http://127.0.0.1:23456
http http://127.0.0.1:23456/ping
http http://127.0.0.1:23456/roll_dice
sleep 1
done
- Check if metrics are being exposed
❯ curl -q localhost:23456/metrics | grep function
  % Total    % Received % Xferd  Average Speed   Time    Time     Time  Current
                                 Dload  Upload   Total   Spent    Left  Speed
100  1471  100  1471    0     0  95687      0 --:--:-- --:--:-- --:--:--  239k
# HELP function_calls_count_total Autometrics counter for tracking function calls
# TYPE function_calls_count_total counter
function_calls_count_total{caller="dispatch_request",function="roll_dice",module="app",objective_name="",objective_percentile="",result="ok"} 30.0
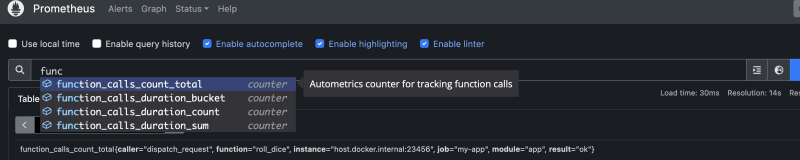
- Verify in prometheus ui as well
Note: This framework works with Opentelemetry as well - more info

Top comments (0)