Oops! Did I fix it or screw it up for real?
Even though we could easily scale this system up vertically and/or horizontally as desired, and the load tested was 20x the expected peak, the rate of failed responses on our load tests before my quest was about 8%.
8% for me is a lot!
8% of €1.000.000.000.000,00 is a lot of money for me (maybe not for Elon Musk).
8% of the world’s population is a good number of people
8% of a gold bar — I’d love to own it!
8% of Charlie Sheen’s ex-girlfriends, damn… That must be tough to handle!
Why is that? Because of previous alarms and metrics I’ve set along the way, I knew something was off, and our throughput was suboptimal, even considering the fairly small number of pods we were running for these services, even if we are talking about outdated libs/technology. And worst… we are only talking about a few hundred requests per second—it should just work, and at a higher scale!
As you will see at the end of this article, performing such load tests in your services can reveal a lot of real issues hidden in your architecture, code, and/or configuration. The smell that “something is off” here indicated that something was indeed off, also for regular usage of those services. Chasing the root cause of problems is always worth it — never ignore errors, considering it’s a “hiccup”. There’s no such thing as a “hiccup” in software. The least that can happen is that you learn more about the software you wrote, the frameworks you use, and the infrastructure that hosts it.
Tech Stack
As there are so many variables in software development (pun intended), I think context is important in this case, and we will limit talking about optimizations on the following pretty common legacy tech stack (concepts apply to others as well — yes, including the latest shit):
Springboot 2.3 + Thymeleaf
MongoDB
Java
Architecture
Architectural changes are not the focus of this article, so I assume some basic understanding of resilient architectures and I won’t write about it besides giving a few notes below on what is expected you are aware of when talking about highly available systems (but again, not limited to):
The network is protected (e.g., divided into public and private or equivalent subnets)
The network is resilient (e.g.: redundant subnets are distributed across different availability zones)
Use clusters and multiple nodes in distributed locations when applicable (e.g. Redis cache clusters, db clusters, service instances deployed in multiple availability zones, and so on)
Use load balancers and distribute load accordingly to your redundant spring boot services.
Have autoscaling in place based on common metrics (e.g.: CPU, memory, latency)
Add cache and edge servers to avoid unnecessary service load when possible (e.g.: Cloudfront)
Add a firewall and other mechanisms for protecting your endpoints against malicious traffic and bots before it hits your workload and consume those precious worker threads (e.g.: WAF)
Health checks are setup.
The minimum number of desired instances/pods is set according to your normal load
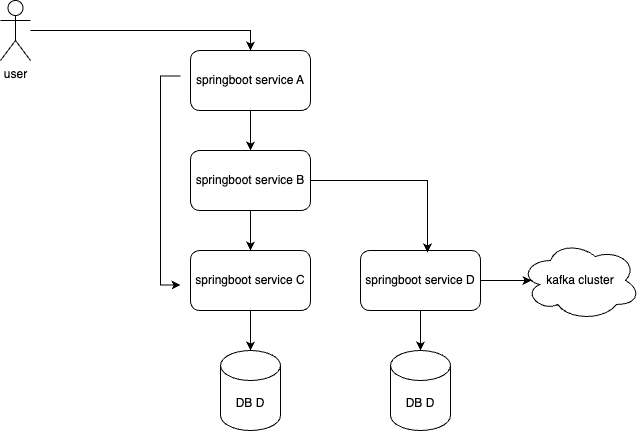
For simplification purposes, I’m reducing the context of this article (and therefore the diagram below) to study only the SpringBoot fine-tuning part of it, in a system similar to the following one:
First things first
As mentioned, the progress I’m describing here was only possible due to measurements and monitoring introduced before the changes. How can you improve something if you don’t know where you are and have no idea where you want to go? Set the f*cking monitoring and alarms up before you proceed with implementing that useless feature that won’t work properly anyway if you don’t build it right and monitor it.
A few indicators you may want to monitor in advance (at least, but not limited to):
SpringBoot Service:
api response codes (5xx and 4xx)
latency per endpoint
requests per second per endpoint
tomcat metrics (servlet errors, connections, current threads)
CPU
memory
DB Cluster:
top queries
replication latency
read/write latency
slow queries
document locks
system locks
CPU
current sessions
For SpringBoot, this is easily measurable by enabling management endpoints and collecting the metrics using Prometheus and shipping metrics to Grafana or Cloudwatch, for example. After the metrics are shipped, set alarms on reasonable thresholds.
For the database, it depends on the technology, and you should monitor it at both the client (spring boot db metrics) and server sides. Monitoring on the client side is important to see if any proxy or firewall is blocking any of your commands from time to time. Believe me, these connection drops may happen even if you test it and it seems to work just fine, in case something is not properly configured and you want to catch it! For example, a misconfiguration of outbound traffic on the DB port on your proxy sidecar may lead to dirty HTTP connections at the spring boot side that were already closed on the server side.
Alright, let’s crash it.
It’s time to set your load test based on your most crucial processes that you know will be under high pressure during peak periods (or maybe that’s already your normal case, and that’s what we should aim for anyway… maximum efficiency with the least amount of resources possible).
In this case, we chose to use this solution from AWS for load testing just because the setup is very simple and we already had compatible JMeter scripts ready for use, but I’d rather suggest using distributed Locust instead for better reporting and flexibility.
In our case, we started simulating load with 5 instances and 50 threads each, with a ramp-up period of 5 minutes. This simulates something like 250 clients accessing the system at the same time. Well, this is way above the normal load we have on those particular services anyway, but we should know the limits of our services… in this case, it was pretty much low, and we reached it quite fast — shame on us!

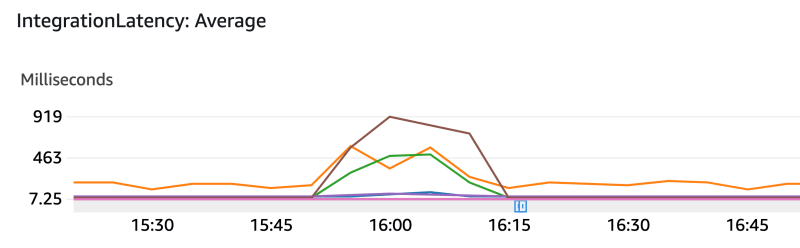
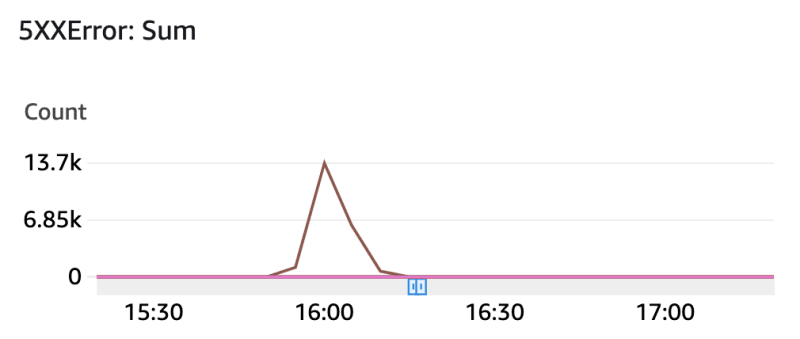
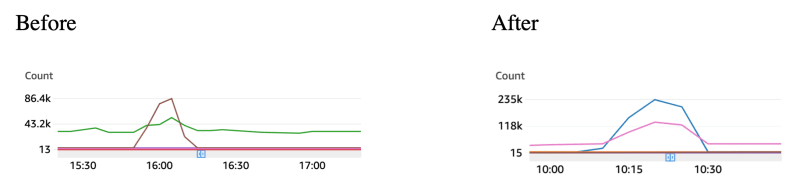
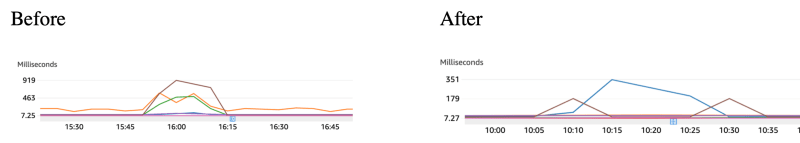
Those metrics above were extracted from our API gateways' automatically generated Cloudwatch dashboard.
There, you can see a couple of things:
1- The load test starts around 15:55 and ends around 16:10
2- The load is only applied to one of the services (see “count” metric)
3- The load applied to one upstream service caused latency in three services to increase (the service the load was applied to + 2 downstream services)
4- A high rate of requests failed with 500s on the service we applied the load to
Therefore, we can conclude that the increased request rate caused bottlenecks in downstream services, which caused latency and probably caused upstream services to timeout, and the errors were not handled properly, resulting in 500 errors to the client (load test). As autoscaling was set up, we can also conclude another important observation: autoscaling did not help, and our services would become unavailable due to bottlenecks!
Connection Pools and HTTP Clients
The first thing I checked was the connection pools and HTTP clients set up so I could get an idea of the maximum parallel connections those services could open, how fast they would start rejecting new connections after all the current connections were busy, and how long they would wait for responses until they started to time out.
In our case, we were not using WebFlux, so I didn’t want to start refactoring services and deal with breaking changes. I was more interested in first checking what I could optimize with minimal changes, preferably configuration only, and only performing larger changes if really needed. Think about the “Pareto rule”, “choose your battles wisely”, “time is money”, and so on. In this case, we were using the Rest Template.
Let’s review what a request flow would look like at a high level:

So, you can see the incoming request is handled by one of the servlet container’s (tomcat) threads, dispatched by Spring’s DispatcherServlet to the right controller, which calls a service containing some business logic. This service then calls a downstream remote service using an HTTP client through a traditional Rest template.
The downstream service handles the request in a similar manner, but in this case, it interacts with MongoDB, which also uses a connection pool managed by Mongo Java Driver behind Spring Data MongoDB.
The first thing I noticed was that the setup was inconsistent, sometimes with missing timeout configurations, using default connection managers, and so on, making it a bit tricky to predict consistent behavior.
Timeouts
As a good practice, one should always check timeouts. Why? Not every application is the same; hence, the defaults might not fit your use cases. For example, database drivers tend to always have absurdly long timeouts by default for queries (such as infinite), as most simple applications might do some background task for performing a query once in a while and return the result to some task, job, or something similar. However, when we are talking about high-scalable and high-throughput systems, one must not wait forever for a query to complete; otherwise, if you have any issue with some specific collection, query, index, or anything like that blocks your DB instances, you will end up piling up requests and overloading all your systems very quickly.
Think of it like a very long supermarket line with a very slow cashier, where the line keeps growing indefinitely and you are at the very end of the line. You can either wait forever and maybe get to the front of the line before the shop closes (and other people will keep queueing behind you), or you (and all the others) can decide after 3s to get out of that crowded place and come back later.
Timeout is a mechanism to give the clients a quick response, avoiding keeping upstream services waiting and blocking them from accepting new requests. Circuit breakers, on the other hand, are safeguards to avoid overloading your downstream services in case of trouble (connection drops, CPU overload, etc.). Circuit breakers are, for example, those waiters or waitresses who send customers back home without a chance to wait for a table when the restaurant is full.
Connection Pool
Remote connections, such as the ones used for communicating with databases or Rest APIs, are expensive resources to create for each request. It requires opening a connection, establishing a handshake, verifying certificates, and so on.
Connection pools allow us to reuse connections to optimize performance and increase concurrency in our applications by maintaining multiple parallel connections, each in its own thread. Given certain configurations, they also give us the flexibility to queue requests for a certain amount of time if all connections from the pool are busy so they are not immediately rejected, giving our services more chances to serve all requests successfully within a certain period.
You might have a quick read of this article for more information about connection pools.
So that’s more or less how it looks after the changes:
@Bean
HttpClient httpClient(PoolingHttpClientConnectionManager connectionManager) {
    return HttpClientBuilder.create()
            .setConnectionManager( connectionManager )
            .build();
}

@Bean PoolingHttpClientConnectionManager connectionManager() {
    PoolingHttpClientConnectionManager connectionManager = new PoolingHttpClientConnectionManager();
    connectionManager.setMaxTotal( POOL_MAX_TOTAL );
    connectionManager.setDefaultMaxPerRoute( POOL_DEFAULT_MAX_PER_ROUTE );
    return connectionManager;
}

@Bean
ClientHttpRequestFactory clientHttpRequestFactory(HttpClient httpClient) {
    HttpComponentsClientHttpRequestFactory factory = new HttpComponentsClientHttpRequestFactory(httpClient);
    factory.setConnectTimeout(CONNECT_TIMEOUT_IN_MILLISECONDS);
    factory.setReadTimeout(READ_TIMEOUT_IN_MILLISECONDS);
    factory.setConnectionRequestTimeout(CONNECTION_REQUEST_TIMEOUT);
    return factory;
}

@Bean
public RestTemplate restTemplate(ClientHttpRequestFactory clientHttpRequestFactory) {
    RestTemplate restTemplate = new RestTemplateBuilder()
        .requestFactory(() -> clientHttpRequestFactory)
        .build();
    return restTemplate;
}
The beans above will ensure the HTTP client used by the Rest template uses a connection manager with a reasonable amount of max connections per route and max connections in total. If there are more incoming requests than we are able to serve with those settings, they will be queued by the connection manager until the connection request timeout is reached. If no attempt to connect is performed after the connection request timeout because the request is still in the queue, the request will fail. Read more about the different types of HTTP client timeouts here.
Make sure to adjust the constants according to your needs and server resources. Be aware that one thread is open for each connection, and threads are limited by OS resources. Therefore, you can’t simply increase those limits to unreasonable values.
Let’s try it again!
So there I was. Looking forward to another try after increasing the number of parallel requests handled by the HTTP clients and seeing a better overall performance of all services!
But to my surprise, this happened:
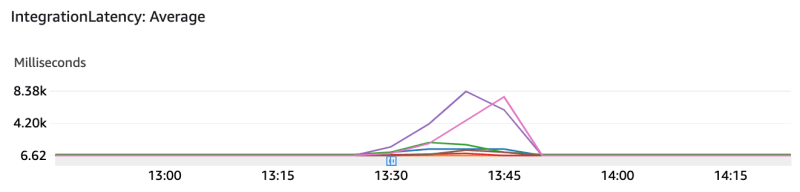

So now our average latency has increased almost 8 times, and the number of errors has also increased! How come?!
MongoDB
Luckily, I also had a monitoring setup for our MongoDB cluster, and there, it was easy to spot the culprit! A document was locked up by several concurrent write attempts. So, the changes indeed increased throughput, and now our DB was overloaded with so many parallel writes in the same document, which caused a huge amount of time waiting for it to be unlocked for the next query to update.
You may want to read more about MongoDB concurrency and locks here.).
As a consequence, the DB connection pool was busy queueing requests, and therefore, the upstream services also started to get their thread pools busy handling incoming requests due to the sync nature of rest templates waiting for a response. This increased CPU consumption in upstream services and caused higher processing times and failures, as we observed in previous graphics!
As MongoDB monitoring pointed me to the exact collection containing the document that was locked and I had CPU profiling enabled (which I’ll describe in the next section), I could easily find the line code causing the lock through an unnecessary save() call in the same document at each service execution for updating one single field, which, to my surprise, never changed its value.
Document locks are necessary for concurrency but are no good as they can easily start blocking your DB connections, and they usually indicate problems with either your code or collections design, so always make sure to review it in case you see some indication your documents are being locked.
After removing the unnecessary save() call, things started looking better — but still not good.


In comparison to the initial measures, the latency is higher, though the error rate dropped to almost 1/3 of the initial amount. Also, in comparison to the first try, it seems the errors are popping up slower than before.
Before proceeding to fix the next bottleneck, let’s review one more thing. Ok, we had an issue in the code that caused the locks, but why did we let queries run for so long? Remember what I wrote initially at connection pools, HTTP clients, and timeout sections. The same applies here: remember to always review default values for your connections and timeouts. MongoDB allows you to overwrite defaults through its connection options.
Connections will be created based on both minPoolSize and maxPoolSize. If queries take longer to be executed and new queries come in, new connections will be created until maxPoolSize is reached. From there, we can also define how long a query can wait to be executed with waitQueueTimeoutMS. If we are talking about DB writes, which was our case here, you should also review wtimeoutMS, which, by default, keeps the connection busy until the DB finishes the write. If setting a value different than the default (never timeout), you may also set a circuit breaker around the DB to ensure you don’t overload it with additional requests. If your DB cluster contains multiple nodes, distribute the load with reads by setting readPreference=secondaryPreffered. Be aware of consistency, read isolation, and recency.
CPU Profiling
If you are working on performance issues, the first thing you should care about is profiling your application. This can be done locally using your favorite IDE or remotely attaching the profiler agent to your JVM process.
Application profiling enables you to see which frames of your application consume the most processing time or memory.
You can read more about Java profilers here. I used the CodeGuru profiler from AWS in this case.
See below an example of an application containing performance issues profiled with CodeGuru.

The large frames indicate a large amount of processing time, and the blue color indicates namespaces recognized as your code. On top of that, sometimes you may have some recommendations based on a detected issue. However, don’t expect it to always point you precisely to the issues in your code. Focus on the large frames and use them to detect parts of the code that normally should not consume so much processing time.
In the example above, one of the main issues seems to be creating SQS clients in the Main class. After fixing it, come back and check what the profiling results look like after some period of time monitoring the new code.
In our case, the profiler indicated a couple of problematic frames in different applications, which caused bottlenecks and, as a consequence, the 500 errors and long latency in the previous graphics.
In general, this either indicates low-performant code (e.g., strong encryption algorithms executed repeatedly) or leaks in general (e.g., the creation of a new object mapper in each request). In our case, it pointed to some namespaces, and after analyzing them, I could find opportunities for caching expensive operations, for example.
Thymeleaf Cache
This was a funny one. A cache is always supposed to speed up our code execution, as we don’t need to obtain a resource for the source again, right? Right…?
Yes, if configured properly!
Thymeleaf serves frontend resources in this service, and it has cache enabled for static resources based on content. Something like the following properties:
spring.resources.chain.enabled=true
spring.resources.chain.strategy.content.enabled=true
spring.resources.chain.strategy.content.paths=/**
However, there are two issues introduced with these three lines.
1- Caching is enabled based on resource content. However, with each request, the content is read from the disk over and over again so its hash can be recalculated, as the result of the hash calculation for the cache itself is not cached. To solve this, don’t forget to add the following property:
spring.resources.chain.cache=true
2- Unfortunately, the service is not using any base path for unifying the resolution of our static resources, so basically, Thymeleaf would try by default to load every link as a static resource from disk, even though they were just controller paths, for example. Keep in mind that disk operations are, in general, expensive.
As I didn’t want to introduce an incompatible change by moving all static resources to a new directory within the resources folder, as it would cause link changes, and I had very well-defined paths for the static resources, I could simply solve it with setOptimizeLocations() from ResourceHandlerRegistration.
Disabling Expensive Debug Logs
Another common mistake is to enable excessive logging, especially logs that print too much too often (e.g., often full stack trace logging). If you have high throughput on your systems, make sure to set up an appropriate log level and log only the necessary information. Review your logs frequently and evaluate if you want to be alerted to warnings and errors when you have your logs clean (e.g., no wrong log levels for debug/trace info).
In this specific case, we had one log line logging a full stack trace for common scenarios. I disabled it as it was supposed to be enabled just for a short period of time for debugging purposes and disabled afterward but it was probably just forgotten.
Auto Scaling Tuning
Auto-scaling settings are easy to get working, but it can be tricky to get them working optimally. The basic thing you can do is enable auto-scaling based on CPU and Memory metrics. However, knowing your services in terms of how many requests per second they are able to handle can help you scale horizontally before your services start to degrade performance.
Check possible different metrics you may want to observe for scaling, set reasonable thresholds, fine-tune scale-in and scale-out cooldown periods, define minimum desired instances according to your expected load, and define a maximum number of instances to avoid unexpectedly high costs. Know your infrastructure and your service implementations inside out.
Giving Another Try
Performing the same load test one more time yielded the following results in comparison with the initial results:
Count: Sum
We are now handling more than double the number of requests within the same 15 minutes of testing.
Integration Latency: Average
The average integration latency in the service, which had load applied, was reduced more than twice compared to before. Meanwhile, downstream services remained with almost constant latency during the tests compared to before, so no more domino effect was observed.
5XXError: Sum

More importantly, errors were gone. The remaining errors we see on the graphic on the right are unrelated to the load test, as we can see in the following report.
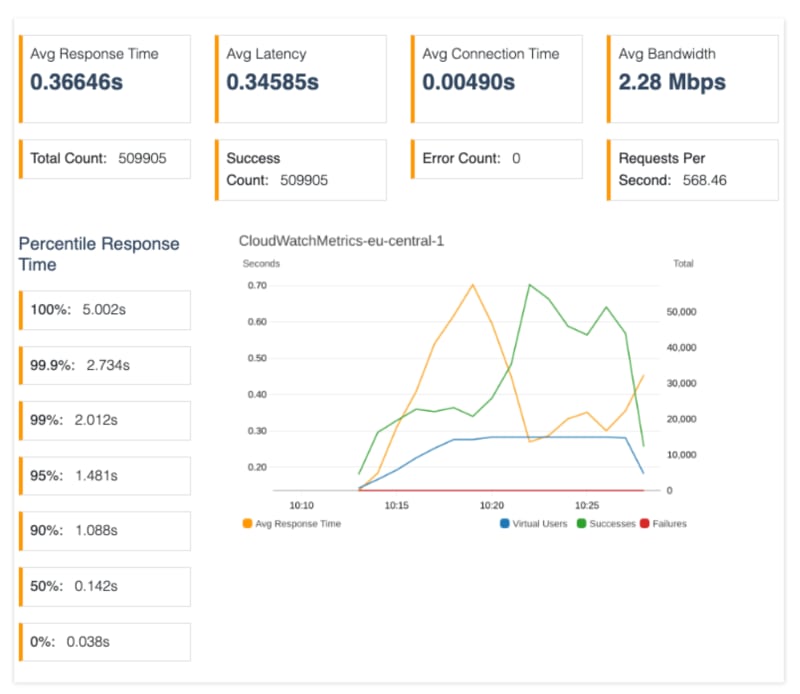
Finally, we can see that auto-scaling changes helped us reduce the average response time to the normal state and keep it stable after about 10 minutes of the test.

Conclusion
Are we done? Of course not.
These optimisations took me about 24 hours of work in total, but they should be performed regularly in multiple systems and different parts of them. However, when considering a large enterprise, such work can quickly become very expensive.
Choosing a good balance between keeping it as it is and becoming obsessed with optimizing every millisecond is tricky, and you should keep in mind that such optimizations bring against opportunity costs.
Do not forget that it’s not only about tuning services to be performant under high load but also making sure your services can produce consistent and correct results under normal conditions as well (e.g., such issues as higher I/O dependencies can lead to “random” unexpectedly longer response times if some jobs are being performed in the background on the operational system of your service instance, for example).
Finally, I often see developers tend to use frameworks and infrastructure without knowing their internals, and this behavior introduces several issues without being noticed. Ensure you understand how your systems behave, what bottlenecks they create, what possible security issues could be exploited, and which settings are available to optimize them to your needs.
I hope this article helps you set the mindset of caring about such aspects of your systems. Good luck!

Top comments (1)
time well spent reading this