
Recently AWS announced an interesting feature in AWS Network Manager called Infrastructure Performance. Now it is possible to monitor the real-time and historical performance of the AWS Global Network in console. In this blog article, we will quickly see how to leverage this for planning the infra and ongoing operations.
What is AWS Network Manager?
AWS Network Manager is a set of tools and features to manage and monitor your network on AWS. You can create global networks, transit gateways, debug VPC reachability, monitor performance, analyze network access, and more.
Creating a global network is beyond the scope of this blog. But let us see how we can leverage infrastructure performance.
Infrastructure Performance
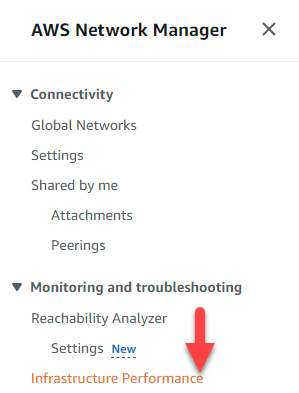
To get started, launch your AWS console and search for network manager in the text box. Click on Network Manager as shown below.

Then, click on Infrastructure Performance from the left menu as shown below.
We can monitor the performance for up- to five intervals and 45-day historical data.
Suppose you have an application hosted in the us-east-2 region, but chunk of traffic originating from us-west-1. To baseline the performance, we can monitor the inter-region latency.
Enter the source as us-west-1 and destination as us-east-2 as shown below and check the row. The network latency will be instantaneously displayed in a graphical view.
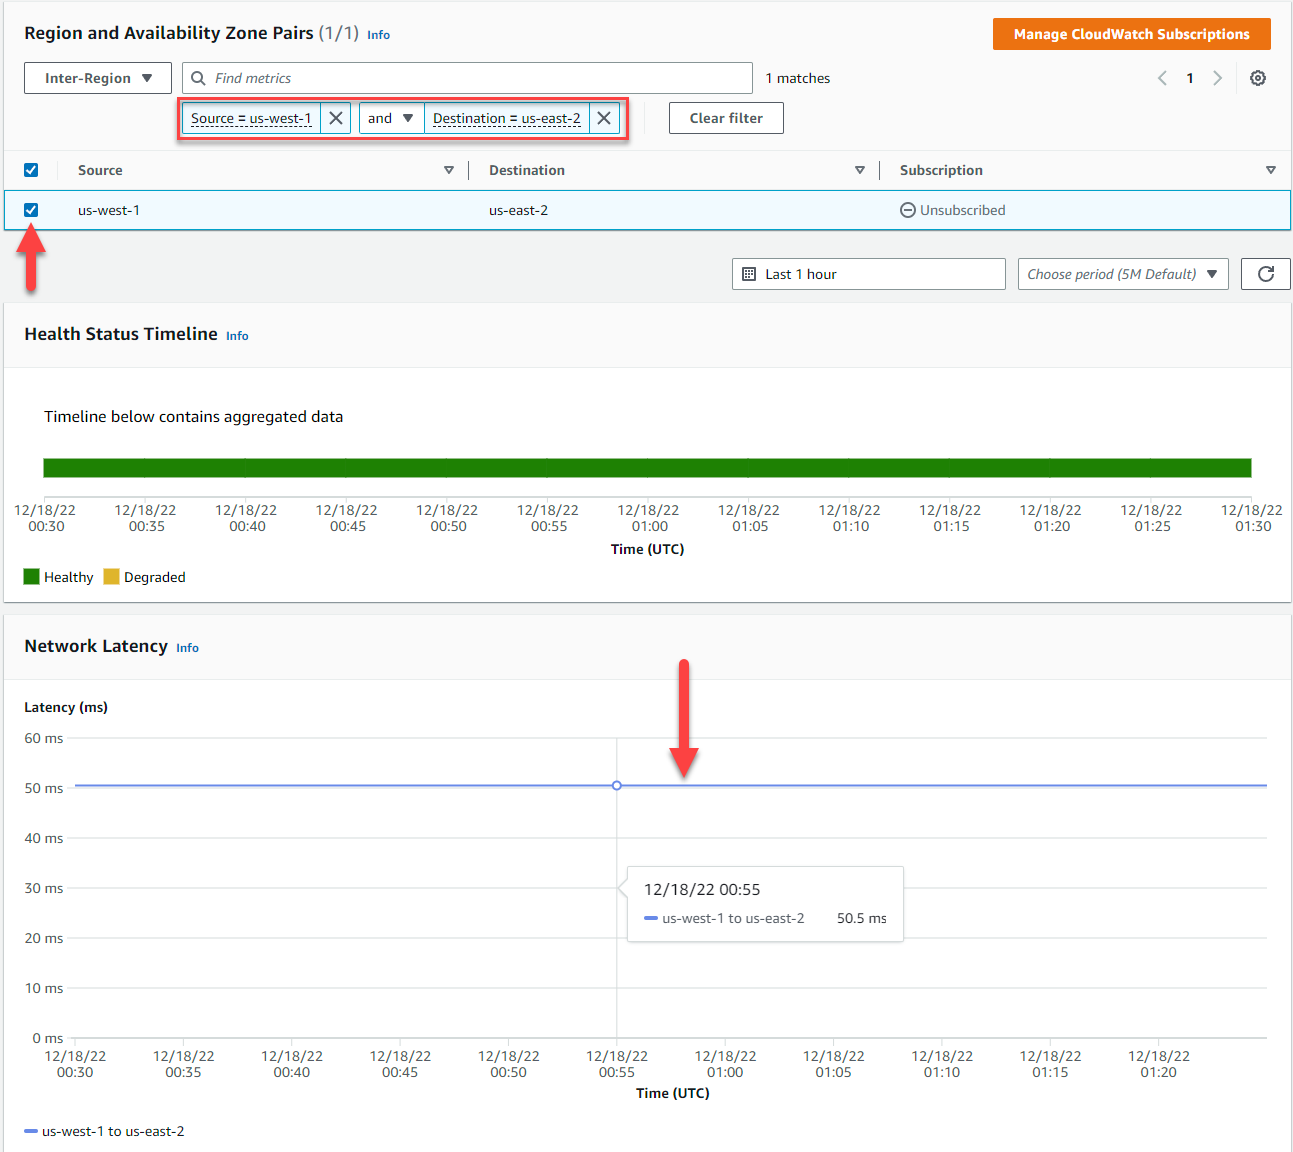
The latency is ~50 ms. You can customize the time range and the interval.
We will not get to know the historical performance prior to Oct 26 2022 00:00:00 GMT+000.
Latency can be measured between Inter-Availability Zone and Intra-Availablity Zone.
Latency Calculation
The latency is calculated from AWS-managed probes for every 5-minute interval with median i.e. 50th percentile of all the latency measurements.
Publishing Metrics to CloudWatch
It is possible to publish these metrics to AWS CloudWatch for analysis purposes. Click Manage CloudWatch Subscriptions, then Confirm

Select Subscribe and then click Confirm.
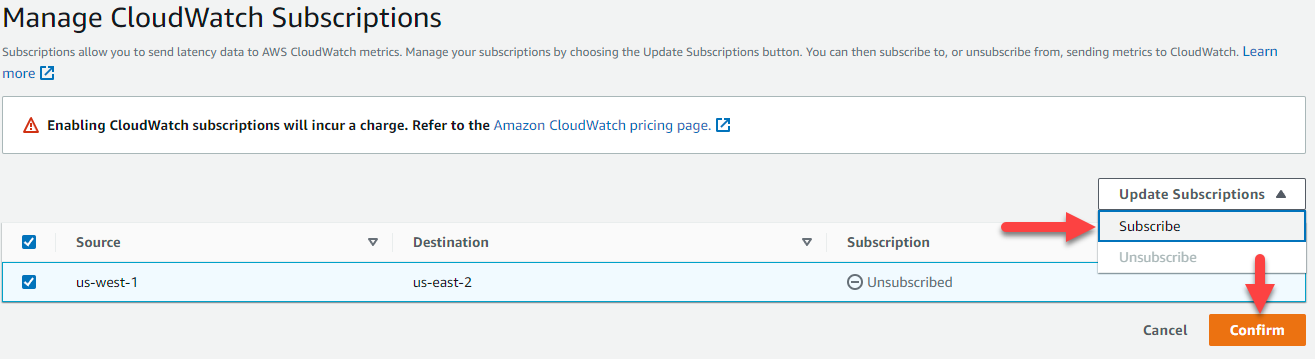
Enabling CloudWatch will incur a charge :)
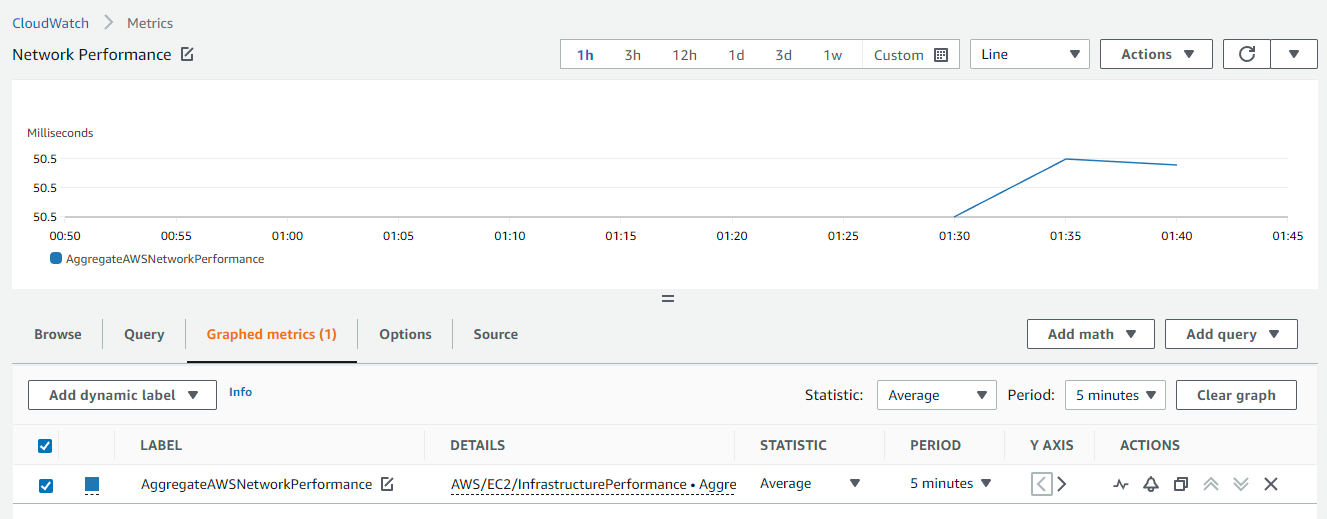
Go to AWS CloudWatch > All Metrics, search for AggregateAWSNetworkPerformance.
You can plot the graph and add it to the dashboard.
Final Thoughts
Monitoring network latency between the regions, inter-az, and intra-az is helpful for operational purposes and for debugging. Streaming the metrics to CloudWatch helps in creating a unified dashboard for easy monitoring. But the historical data should be available for free instead of billing customers for AWS CloudWatch usage.

Top comments (2)
As someone who knows Azure networking, thansk for writing this article about AWS Network Manager.
Thank you 🙏