
If you are somebody who has just started off with Data Analytics and want to get a brief idea about the roadmap of how to plan a project, this article is for you. It has just the "enough" basics to get you started.
Any time you observe and evaluate something in the world, you’re collecting and analyzing data. Your analysis helps you find easier ways of doing things, identify patterns to save you time, and discover surprising new perspectives that can completely change the way you experience things.

Here is a real-life example of how one group of data analysts used the six steps of the data analysis process to improve their workplace and its business processes. Their story involves something called people analytics — also known as human resources analytics or workforce analytics. People analytics is the practice of collecting and analyzing data on the people who make up a company’s workforce in order to gain insights to improve how the company operates.
Being a people analyst involves using data analysis to gain insights about employees and how they experience their work lives. The insights are used to define and create a more productive and empowering workplace. This can unlock employee potential, motivate people to perform at their best, and ensure a fair and inclusive company culture.
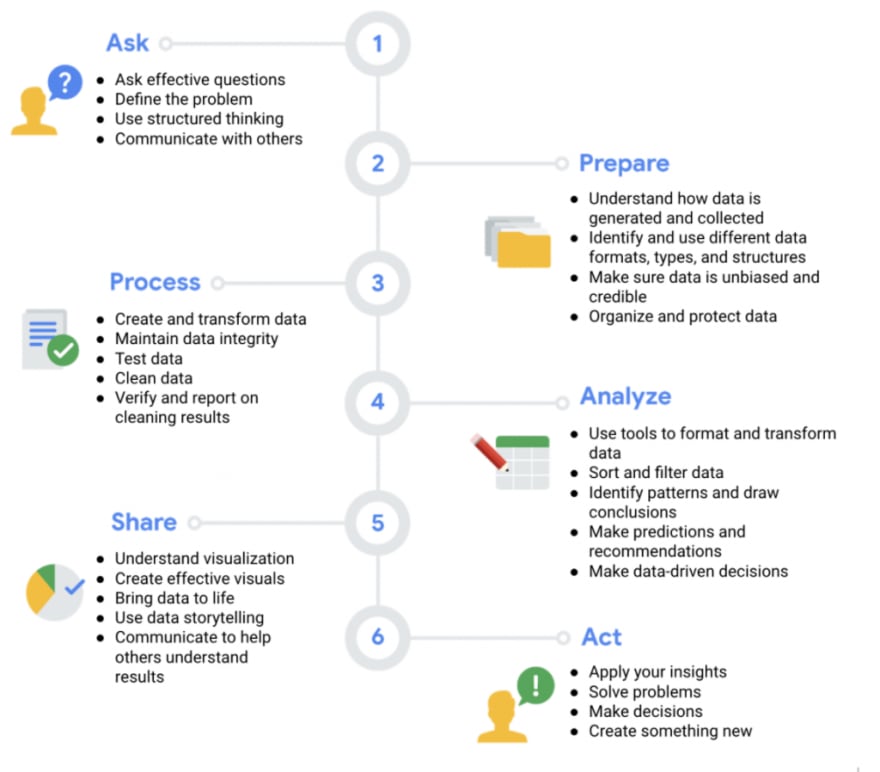
The six steps of the data analysis process that you have been learning in this program are: ask, prepare, process, analyze, share, and act . These six steps apply to any data analysis. Continue reading to learn how a team of people analysts used these six steps to answer a business question.
An organization was experiencing a high turnover rate among new hires. Many employees left the company before the end of their first year on the job. The analysts used the data analysis process to answer the following question: how can the organization improve the retention rate for new employees?
Here is a break down of what this team did, step by step.

First up, the analysts needed to define what the project would look like and what would qualify as a successful result. So, to determine these things, they asked effective questions and collaborated with leaders and managers who were interested in the outcome of their people analysis. These were the kinds of questions they asked:
- What do you think new employees need to learn to be successful in their first year on the job?
- Have you gathered data from new employees before? If so, may we have access to the historical data?
- Do you believe managers with higher retention rates offer new employees something extra or unique?
- What do you suspect is a leading cause of dissatisfaction among new employees?
- By what percentage would you like employee retention to increase in the next fiscal year?

It all started with solid preparation. The group built a timeline of three months and decided how they wanted to relay their progress to interested parties. Also during this step, the analysts identified what data they needed to achieve the successful result they identified in the previous step - in this case, the analysts chose to gather the data from an online survey of new employees. These were the things they did to prepare:
- They developed specific questions to ask about employee satisfaction with different business processes, such as hiring and onboarding, and their overall compensation.
- They established rules for who would have access to the data collected - in this case, anyone outside the group wouldn't have access to the raw data, but could view summarized or aggregated data. For example, an individual's compensation wouldn't be available, but salary ranges for groups of individuals would be viewable.
- They finalized what specific information would be gathered, and how best to present the data visually. The analysts brainstormed possible project- and data-related issues and how to avoid them.

The group sent the survey out. Great analysts know how to respect both their data and the people who provide it. Since employees provided the data, it was important to make sure all employees gave their consent to participate. The data analysts also made sure employees understood how their data would be collected, stored, managed, and protected. Collecting and using data ethically is one of the responsibilities of data analysts. In order to maintain confidentiality and protect and store the data effectively, these were the steps they took:
- They restricted access to the data to a limited number of analysts.
- They cleaned the data to make sure it was complete, correct, and relevant. Certain data was aggregated and summarized without revealing individual responses.
- They uploaded raw data to an internal data warehouse for an additional layer of security.

Then, the analysts did what they do best: analyze! From the completed surveys, the data analysts discovered that an employee’s experience with certain processes was a key indicator of overall job satisfaction. These were their findings:
- Employees who experienced a long and complicated hiring process were most likely to leave the company.
- Employees who experienced an efficient and transparent evaluation and feedback process were most likely to remain with the company.
The group knew it was important to document exactly what they found in the analysis, no matter what the results. To do otherwise would diminish trust in the survey process and reduce their ability to collect truthful data from employees in the future.

Just as they made sure the data was carefully protected, the analysts were also careful sharing the report. This is how they shared their findings:
They shared the report with managers who met or exceeded the minimum number of direct reports with submitted responses to the survey.
- They presented the results to the managers to make sure they had the full picture.
- They asked the managers to personally deliver the results to their teams.
This process gave managers an opportunity to communicate the results with the right context. As a result, they could have productive team conversations about next steps to improve employee engagement.
The last stage of the process for the team of analysts was to work with leaders within their company and decide how best to implement changes and take actions based on the findings. These were their recommendations:
- Standardize the hiring and evaluation process for employees based on the most efficient and transparent practices.
- Conduct the same survey annually and compare results with those from the previous year.
A year later, the same survey was distributed to employees. Analysts anticipated that a comparison between the two sets of results would indicate that the action plan worked. Turns out, the changes improved the retention rate for new employees and the actions taken by leaders were successful!
Is people analytics right for you?
One of the many things that makes data analytics so exciting is that the problems are always different, the solutions need creativity, and the impact on others can be great — even life-changing or life-saving. As a data analyst, you can be part of these efforts. Maybe you’re even inspired to learn more about the field of people analytics. If so, consider learning more about this field and adding that research to your data analytics journal. You never know: One day soon, you could be helping a company create an amazing work environment for you and your colleagues!
Source: Data, Data, Everywhere...

Top comments (1)
very well explained 👏👏👏. looking forward for more.