
Originally posted on the Hosted Graphite blog.
At Hosted Graphite, internal system monitoring is something our engineers are always concerned about. To detect any degradation we continuously self-test all our endpoints — every second, every day. It gives us an early warning sign of small changes that could be an indicator of larger problems and lets us know how well our service is running. We try to measure what our customers are actually experiencing and this is one of the main metrics of service quality that we grade ourselves on.
How does it work?
Each canary service sends a value of '1' once per second with the appropriate timestamp to each endpoint that we accept metric traffic on.
In the case of any TCP connections we re-establish a new connection each time (and record the time taken) to allow measurement of network delays and services being overloaded.
We can then continuously monitor these metrics for any drop in value.
This system lets us know if something’s wrong: when the amount of traffic we record drops below an acceptable loss amount for a particular service, our alerting tools raise the alarm. We can then check on the exact number of failed data-points by looking at our sum dataviews presented on a dashboard. These figures are aggregated and grouped by protocol and source network, allowing us to determine the extent of the degradation at a glance. We can answer the "Just one AWS zone?" or "All UDP services?" questions extremely quickly because of this continuous, distributed monitoring.
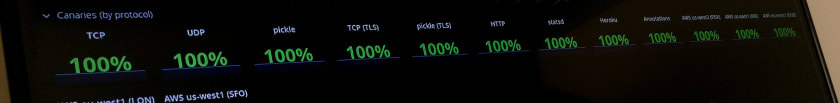
A snippet of the canaries dashboard — all green right now!
The juicy details
We test all our endpoints. That includes TCP, TCP w/ TLS, UDP, Pickle, Pickle w/ TLS, and HTTPS. Our test sends a datapoint every second to make sure we pick up on any degradation of service. To make sure we're not falsely covering-up a delay in accepting the data or establishing a connection, the canary has been carefully engineered to send one datapoint per second and to abandon the attempt if it takes longer than a second, ensuring a very reliable continuous rate of one value per second no matter what.
If it takes longer than a second to connect and submit a datapoint, we'd record that as a dropped datapoint, because we care about the data delivery rate as well as how long it takes for us to accept it.
A single datapoint gets sent for each protocol and these go to our Graphite-compatible endpoints. The sum rate of these metrics is then rendered in our alerting service and if the value drops below acceptable loss for a particular service, an on-call engineer is paged.

Canary sumrates dashboard — we offset the line at 2.0 from 1.0 for a clear view of both on the same graph
Locations
Our canary services are located in three places:
External
The external canaries are all located outside of the main Hosted Graphite architecture/pipeline. They’re tagged and sent from different places, all over the world. We do this so that we can understand if, for example, there’s a problem with traffic from a specific region.
Internal
We run more canaries that sit within our own data centre. This allows us to test our local network so we can differentiate a failure that is likely due to some mishap in our own service as opposed to external connectivity issues.
On-machine
While we send canary data from many locations outside and inside our network, we also send a continuous stream of canary data locally from each of our ingestion services to itself so failures of a single machine or service are immediately apparent. This data is also used automatically by our clustering and service discovery tools, allowing auto-remediation of most common individual machine failure types.
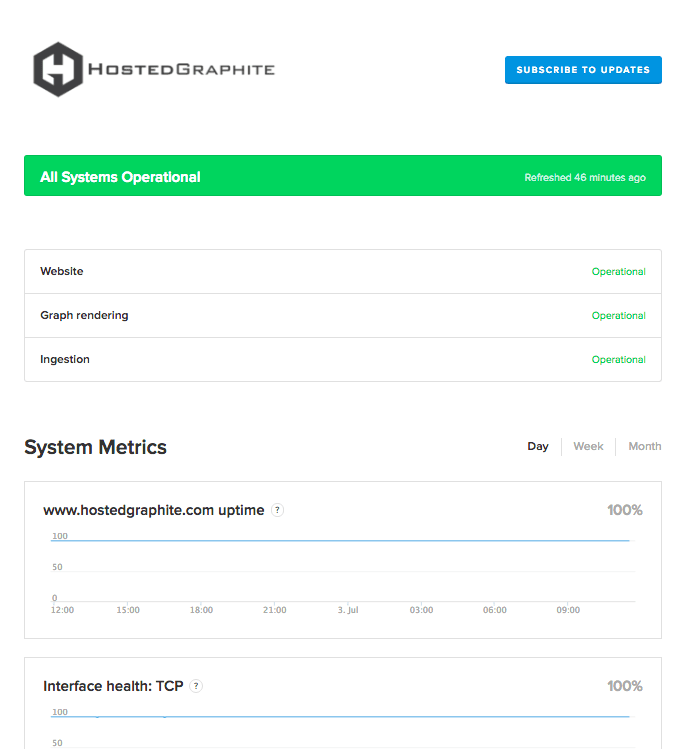
Status page (includes full incident history)
For transparency, we publish all the details on our status page so our customers have full visibility of any blip in our service and real time status information. We include a full breakdown of what caused the issue, who it affected, and how the issue has been resolved.
Written by Dan Fox, SRE at Hosted Graphite.

Top comments (0)