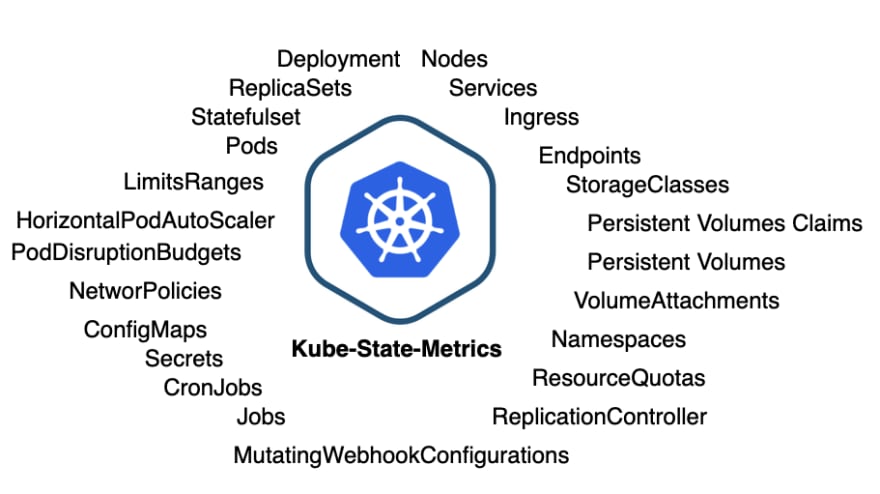
In a pursuit to monitor our Kubernetes Cluster we often need the right set of tools to capture, the right metrics. Although there are a couple of tools present already, today let’s discuss Kube-state-metrics.
What is Kube-State-Metrics?
Kube-State-Metrics is an open-source light-weight utility used to monitor the Kubernetes Cluster. As the name suggests, it provides information about the state of a couple of Kubernetes objects by listening to Kubernetes API. Kube-State-Metrics acts like a Swiss Army Knife that provides metrics for a long list of Kubernetes-Objects.
Installing: Kube-State-Metrics
git clone [https://github.com/kubernetes/kube-state-metrics](https://github.com/kubernetes/kube-state-metrics)
kubectl apply -f kube-state-metrics/examples/standard/
This will go ahead and install all the components needed such as ServiceAccount, ClusterRole, ClusterRolebinding along with Deployment, and Service.
Let’s test it locally, by exposing the service, run the command
kubectl port-forward svc/kube-state-metrics -n kube-system 8080:8080
Scrapping: Kube-State-Metrics with Prometheus
As we already, know Kube-state-metrics is Prometheus friendly let's get started with scrapping the Kube-State-metrics with Prometheus.
Assuming that you have already installed on Prometheus on your cluster, you can use the above Prometheus Configuration to start scraping metrics.
if you found this article useful, feel free to click ❤️ heart many times or share it with your friends.


Top comments (0)