
In a previous post, I laid out a basic no code solution to track Dev.to total pageviews and reaction counts using Integromat and Airtable.
This post is going to build upon the Integromat scenario that you created previously, as well as add a new scenario that connects with Plotly to provide some simple visualizations of the data.
As before, the prerequisites are the same, with one addition:
- An Integromat account(free).
- An Airtable account(also free).
- A Dev.to profile, and at least one published post.
- A Plotly Chart Studio account(also free).
I'd suggest completing the previous post before starting here. If not, that's fine, just be sure to have your accounts set up. Some familiarity with Integromat will also be beneficial.
Create A New Table
You'll be collecting the same data from your Dev.to profile, but storing it in a different way inside Airtable.
Open up the Airtable base from the previous post(mine is called "Dev.to metrics"), and add a new table to it:

Name the table something to distinguish it from the previous table, such as "Dev.to timeseries".
You'll need to set the new table up as follows:
- Change the first field(column) type from "Single Line Text" to "Formula".
- For the formula, enter
CREATED_TIME(). Change the formatting to not include a time field. - Change the 2nd field to a "Number" type. Set it as an integer(instead of decimal), and title the field "Total Post Views".
- Change the 3rd field to a "Number" type. Set it as an integer, and title the field "Total Reaction Count".
- Add a 4th field with a "Formula" type, enter
RECORD_ID()in the formula, and title the field "Record ID".
The fields should look as follows when complete:

Next, you're going to update the scenario from the previous post to update this new table.
Update Your Scenario With The New Module
NOTE: If you haven't yet worked through the previous post, I'd recommend doing so now. If you want only finish the bare minimum needed to proceed here, you can stop after creating the HTTP module to pull from Dev.to.
In the Integromat scenario you created to pull metrics from the Dev.to API, you'll be adding a new Airtable module to update the newly created table.
Click the "+" symbol in the "Router" module to create a 3rd module.
Add a new Airtable module and choose "Create a record" from the popup menu:

You'll be configuring the module to update your newly created table with total page views and total reaction count. It will be using the same functions from the modules in the previous post. The fully configured module should look similar to this:

Rather than updating the same records(rows), this module will create a new record each time it runs. Since you added a formula field for "created time", Airtable will automatically populate the date that the record was created.
Choose a meaningful name for the new module. It should look similar to this:

Go ahead and perform a manual run of the scenario to test it. Once it completes, verify that a new record was created in your timeseries table:

This represents a basic data model for what is needed to plot timeseries data. A data point, as well as a fixed time at which the data was sampled.
Next, you'll create a new Integromat scenario poll and visualize this data using Plotly.
Visualize Your Data
If you haven't yet, you'll need to go ahead and set up your free account on Plotly Chart Studio. You'll need to grab your API key from (here)[https://chart-studio.plotly.com/settings/api#/].
Next, create a new scenario in Integromat. You'll be using the "Airtable" and "Plotly" modules, as well as a router module.
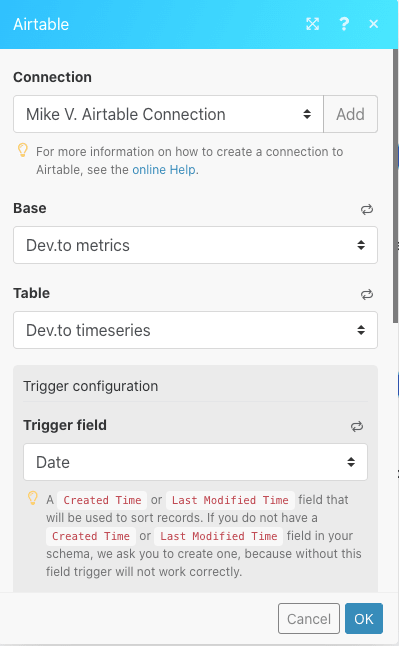
Create a new Airtable module as the first module in the scenario. In the popup menu, you now have access to a trigger called "Watch records", go ahead and choose it.
Configure the module to utilize the "Dev.to metrics" base, and the table created earlier in the post. The "Trigger field" will be the "Date" field from the table. The configured module should look similar to this:
Next, add a "Router" module. As in the previous post, the Router will send identical data streams to separate modules for processing. Click the "+" in the module to create two flows with blank modules. On the top-most blank module, set up a Plotly module and choose "Create a graph":

As in previous modules, you'll need to set up a connection. Integromat needs your Plotly username and API key, so go ahead and enter them.
There a few more configuration options compared to previous modules, so here's a high-level walk-through of what these modules are meant to accomplish:
- Creating a "file" in Chart Studio, which will be the data and graph.
- Updating the same file continuously with additional data points.
- The X-axis will show dates, and the Y-axis will show the metric count being tracked.
- The graph type will be an extended scatterplot.
Start with graphing the metric for total views.
First, choose a file name that is meaningful, such as "total_post_views".
"Graph type" will be "Scatterplot".
"X Values" and "Y Values" will be populated with the data from the Airtable module that you created for this scenario. Choose "Created time" for the X Value and "Total Post Views" for the Y Value:

Enter "Date" for the "X axis title" , and "X axis type" will be "Linear".
Enter "Total Post Views" for the "Y axis title", and "Linear" for the "Y axis type".
When completed, it should look similar to this:

For the second module, it will be almost identical to the first, except it will be creating a separate graph to track total reaction count.
Configure the module, choosing a different file name and specifying the reaction count metric for the Y axis.
When completed, it should look similar to this:

You're almost done!
Go ahead and manually run the scenario. After a moment, each Plotly module should have a little white bubble to the upper right. Click on it. You should see a URL for a Plotly chart in the output:

Go ahead and copy that URL into a new browser tab and hit enter.
You should see a Plotly graph with a single data point. Congratulations, you've just graphed your Dev.to metrics!
Go ahead and confirm that the total reaction count module generated a similar URL with Plotly.
One last thing you'll want to do is create a dashboard in Chart Studio.
Create a Data Dashboard
Obviously, it's not super convenient to click through each module in an Integromat scenario every time you want to view these metrics. Fortunately, Plotly provides a dashboarding functionality that's easy to set up.
Go ahead and click "My files" at the top of the Chart Studio UI:

You should see an interface containing all of your graphs and grids. On the left, click the blue "New" button and choose "Dashboard":
You should be greeted with an empty dashboard:

Click "Plot" and choose "Your Files":

Then choose one of the files created by the Airtable scenario:

Enter a title at the top. Click the "+Plot" button at the bottom of the UI to add the other metric to the dashboard, giving it an appropriate title.
Click the blue "Save" button at the bottom of the UI, giving your dashboard an appropriate name.
Now if you go back to "My Files", you'll see your new dashboard there, with a shareable link that can be bookmarked for further viewing.
All done! You've now got an automated system that will help you visualize your Dev.to metrics. Down the road, you could add additional functionality like a Slack notification or email, to alert you when the graph has been updated.
A Note Regarding scheduling in Integromat: Choosing a scheduling interval depends on how granular you want the data to be. Free accounts limit to two active scenarios, and 15 min intervals. However, running the Dev.to polling scenario and this one every 15 minutes will quickly consume your allotted actions before the free counter is reset.
Obviously, it doesn't make sense to run the graphing scenario any more frequently than the polling scenario runs. For my own scenarios, I chose once every 24 hours, with the graphing scenario running 30-60min after the polling scenario.
Thanks for reading, stay healthy and safe!

Top comments (5)
I have to be honest: I always wondered about the usefulness of "no-code" flow tools. Either they are too primitive to be versatile, or too complex to save time. I therefore see them in the realm of "when you can think like a coder but can't code" target group. And looking at your example, I cannot help but wonder: if I run a cron and use a dev.to SDK to trigger the API to drop data into a simple file-based database, wouldn't I achieve what you showcase here much faster?
That seems like a fairly reductionist take on the utility of these tools. There are plenty of examples of career "coders" taking advantage of the fast-iteration loop they offer.
Well, sure, maybe. But how do you define: "faster"?
I can code too(Python, Go, Bash, and a little Node), and yes I could absolutely set up an API Gateway -> Lambda -> SimpleDB, or 100 other variations of "Cron 2.0".
But I don't.
Because it's just not interesting.
When I'm prototyping MVPs, building products, trying things out, making small bets, I want the fastest feedback loop I can possibly manage.
Spending a lot of time on boring business logic and low-ceiling automation just is not interesting or inspiring work.
I'm not solving any new problems, I'm not designing anything new or novel. I'm just creating more code to manage that doesn't actually have anything to do with core functionality.
This podcast is a great take on a coder using no code tools to be productive while saving effort to work on actually interesting things: indiehackers.com/podcast/149-greg-...
I'd rather spend a few hours on a weekend quickly building an MVP that fails fast, rather than spending time coding up everything by hand only to delay receiving the same data.
If an MVP gains traction, then you can start porting no code to code, if it actually makes sense or needs to scale.
At the end of the day, I'd rather save my energy for interesting problems, and deal with low hanging fruit quickly and with absolutely minimal technical complexity.
I didn't want to step on your toes, but here is my experience with the approach you are describing:
I have worked on multiple projects where no-code solutions initially looked like a faster way of achieving a POC (including ones where I was personally involved due to the fact that I co-authored the flow/no-code software as I should admit). In ALL cases one of the following happened:
Either it turned out that the wanted outcome ended up exceeding the capabilities of the tools at hand or it actually was sufficient but ended up being a nightmare after change requests came in.
The crux of what you are saying is basically: if the complexity is low enough, then no-code is a faster, less "boring" way of generating logic. But the problem is that if the complexity is low enough, then a scaffolding approach via the right framework is not only still way faster, but actually enables me to build out a stable version without starting from scratch if the concept prevails.
Of course there is the personal preference of what you consider "more fun", as I read between your lines. And that's fine. I don't want to discourage anyone from using what works for them. I also believe we need people that like to work like that in order to get technology to the point where it's convincing in the near future. But all that doesn't change the fact that I am willing to challenge the gist of what you are saying, and your article is the perfect example for that. It simply isn't an easier, faster approach in general - it's an approach that enables people to achieve something they otherwise couldn't. And while I am sure this fact will eventually change, as if now I am willing to bet that an experienced developer can outperform any no-code solution out there - whether the measurement is time, flexibility, stability or functionality as long as using the appropriate tools were allowed.
I guess ultimately I'm wondering why you seem so invested in the need to "challenge" me?
I won't pre-suppose your intent, but your writing comes off very much like gatekeeping.
It just smells like the classic FUD response I see in response to no code.
"Well that's not how a real developer would do it".
I fear that puts off people with less experience, who might use these tools and grow into full-on developers later, because they feel like they're not "real" or doing it right.
I just don't see an issue with democratizing approaches like this, even for "experienced" developers.
Ok, so apparently I phrased that the wrong way: I don't want to challenge you in the sense that I think a no-code approach is "the wrong way" of going about things. I have just personally come to the conclusion that we are not there yet; meaning that these solutions aren't viable options for people who can actually code. At the same time, I realize that this will eventually change.
What I AM challenging is that this approach is a faster, easier or even more interesting approach in a scenario where you could achieve the same outcome in a "code solution".
And I think what you say about enabling more people to do things is completely accurate (not sure if I would call that democratizing, but let's ignore semantics), I am just under the impression that we need to be honest with the current state of technology:
Yes, when you cannot walk, it's amazing what you can achieve with a wheelchair. And I applaud good engineering in that respect. At the same time, I wouldn't state that a wheelchair is comparable to walking on your own feet. But I am fully aware that one day there might be a exoskeleton that will make using your own legs a less powerful solution.