
I recently came across an interesting memory leak scenario which caught me off-guard, let’s see if you can spot the issue before the reveal at the end?
Below is some simplified replica code:
const express = require("express");
const { getSponsored, getRecommendations, getProducts } = require("./fetchers");

const app = express();

const baseResponse = {
  filters: [],
  products: [],
  subCategories: [],
};

function mergeResponses(responses) {
  return responses.reduce((finalResponse, response) => {
    finalResponse.filters.push(...response.filters);
    finalResponse.products.push(...response.products);
    finalResponse.subCategories.push(...response.subCategories);

    return finalResponse;
  }, baseResponse);
}

app.use("/products", async (req, res) => {
  const responses = await Promise.all([
    getSponsored(),
    getRecommendations(req),
    getProducts(),
  ]);

  res.send(mergeResponses(responses));
});

app.listen(3000);
The functionality is relatively straight-forward — we have a /products endpoint when is getting some sponsored, recommended, and normal products, merging parts of the results, and returning this aggregation as the response.
Now the use of Array.prototype.reduce() for the response merge is curious — we’re concatenating arrays so a simple for loop or .forEach() feels more appropriate, but hey for small responses at reasonably low RPS this is micro-optimisation, nothing to get too hung up on!

Photo by Clément Hélardot on Unsplash
But yet running something similar in a production like environment it was apparent that something was off... monitoring showed that old heap size was growing linearly with the number of requests — we had a memory leak!
The memory heap is divided into two major spaces: the New space where new objects are allocated, and the Old space where older objects are moved to after surviving for some time having not been garbage collected.
Debugging a memory leak
A straight-forward way to start an investigation into a Node memory leak when you can run the project locally (debugging in production is a different matter!) is to use the Node inspector, this can be invoked easily through a flag when starting your Node application:
$ node --inspect index.js

Debugger listening on ws://127.0.0.1:9229/2a7f05cd-96c8-4f6d-8c5f-adea987ab63b
For help, see: https://nodejs.org/en/docs/inspector
This will prompt the Node process to listen for a debugging client which, once connected, allows you to instrument your application with breakpoints as well as resource metrics and analysis for CPU and memory.
There a few options for debuggers — major IDEs like Visual Studio, Visual Studio Code, and JetBrains Webstorm all support the protocol making for easy debugging from within your editor. Here I’ll demonstrate an alternative, using Chrome DevTools.
Once your Node process is running with the inspector, open up Chrome and navigate to chrome://inspect in the URL address bar.

Here under the “Remote Target” section we can click on the “inspect” link to starting interrogating our index.js Node process.

Clicking this link pops open a new Chrome DevTools tab which is very similar to what you would get while debugging a page in the browser.
On the Memory tab we can click the “Take snapshot” button while the “Heap snapshot” option is selected to record a snapshot in time of the memory heap. This will pop up on the left sidebar and generally will automatically open up.
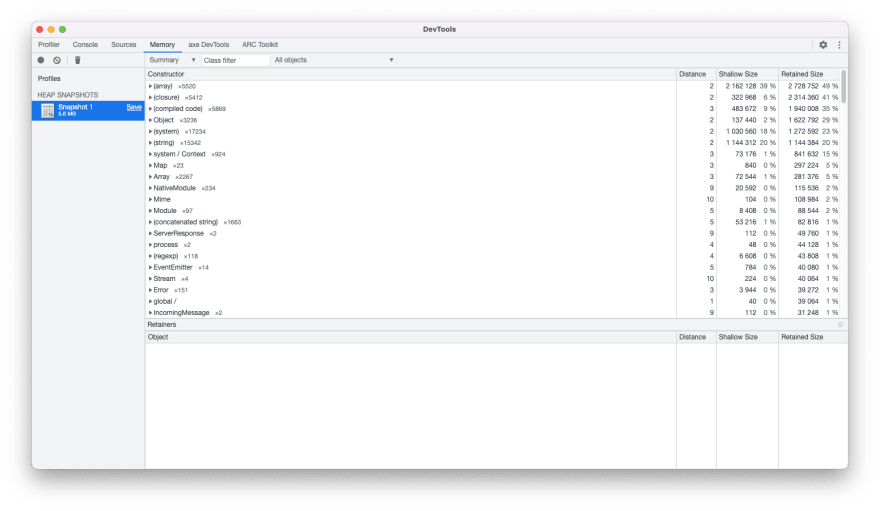
From this snapshot we can see all of the “constructors” (think primitives or objects) with columns for the distance from the window object, the size of each object in bytes, and the retained size of the object in bytes (the size of the object and the graph it retains).
This doesn’t yet give us enough information to easily assess where a memory leak might be, but can be interesting to peruse to understand the shape of your application’s memory.
Now in our case the memory leak appeared to be correlated to the amount of traffic the server was receiving, so to simulate that we can use tools like autocannon to very easily generate some base level load on the server.
Here was run one of three:
$ npx autocannon -c 100 http://localhost:3000/products

Running 10s test @ http://localhost:3000/products
100 connections

    ┌─────────┬────────┬─────────┬─────────┬─────────┬───────────┬───────────┬─────────┐
    │ Stat    │ 2.5%   │ 50%     │ 97.5%   │ 99%     │ Avg       │ Stdev     │ Max     │
    ├─────────┼────────┼─────────┼─────────┼─────────┼───────────┼───────────┼─────────┤
    │ Latency │ 158 ms │ 1232 ms │ 2860 ms │ 3440 ms │ 1296.6 ms │ 786.21 ms │ 5350 ms │
    └─────────┴────────┴─────────┴─────────┴─────────┴───────────┴───────────┴─────────┘
    ┌───────────┬─────────┬─────────┬─────────┬─────────┬─────────┬─────────┬─────────┐
    │ Stat      │ 1%      │ 2.5%    │ 50%     │ 97.5%   │ Avg     │ Stdev   │ Min     │
    ├───────────┼─────────┼─────────┼─────────┼─────────┼─────────┼─────────┼─────────┤
    │ Req/Sec   │ 27      │ 27      │ 46      │ 147     │ 61.8    │ 35.14   │ 27      │
    ├───────────┼─────────┼─────────┼─────────┼─────────┼─────────┼─────────┼─────────┤
    │ Bytes/Sec │ 34.4 MB │ 34.4 MB │ 60.6 MB │ 80.7 MB │ 60.7 MB │ 13.3 MB │ 34.4 MB │
    └───────────┴─────────┴─────────┴─────────┴─────────┴─────────┴─────────┴─────────┘

Req/Bytes counts sampled once per second.
# of samples: 10

718 requests in 10.09s, 607 MB read
... and run three of three:
$ npx autocannon -c 100 http://localhost:3000/products

Running 10s test @ http://localhost:3000/products
100 connections

    ┌─────────┬─────────┬─────────┬─────────┬─────────┬────────────┬────────────┬─────────┐
    │ Stat    │ 2.5%    │ 50%     │ 97.5%   │ 99%     │ Avg        │ Stdev      │ Max     │
    ├─────────┼─────────┼─────────┼─────────┼─────────┼────────────┼────────────┼─────────┤
    │ Latency │ 1554 ms │ 5400 ms │ 9049 ms │ 9189 ms │ 5389.29 ms │ 2438.84 ms │ 9314 ms │
    └─────────┴─────────┴─────────┴─────────┴─────────┴────────────┴────────────┴─────────┘
    ┌───────────┬─────┬──────┬─────────┬────────┬─────────┬─────────┬─────────┐
    │ Stat      │ 1%  │ 2.5% │ 50%     │ 97.5%  │ Avg     │ Stdev   │ Min     │
    ├───────────┼─────┼──────┼─────────┼────────┼─────────┼─────────┼─────────┤
    │ Req/Sec   │ 0   │ 0    │ 6       │ 36     │ 10.6    │ 11.62   │ 6       │
    ├───────────┼─────┼──────┼─────────┼────────┼─────────┼─────────┼─────────┤
    │ Bytes/Sec │ 0 B │ 0 B  │ 22.4 MB │ 128 MB │ 38.1 MB │ 41.5 MB │ 22.4 MB │
    └───────────┴─────┴──────┴─────────┴────────┴─────────┴─────────┴─────────┘

Req/Bytes counts sampled once per second.
# of samples: 10

232 requests in 10.09s, 381 MB read
26 errors (26 timeouts)
We can see here that something is very definitely wrong — after only 3 batches of 10 second load periods serving 100 connections we’ve gone from an average latency of 1296.6 ms to 5389.29 ms, a degradation of over 4 seconds!
Let’s take another heap snapshot using the “record” button at the top left of the Chrome DevTools Memory tab.
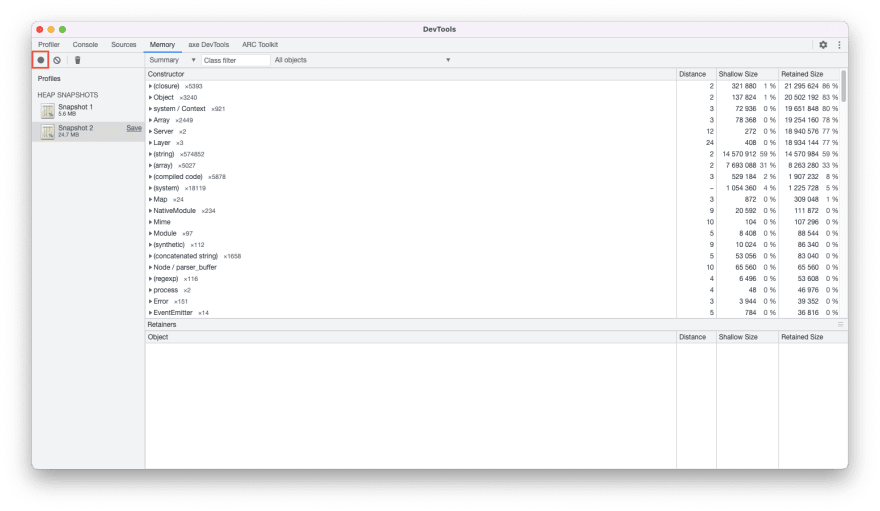
We can see that there certainly appears to be a lot more memory in play — the total snapshot size (listed under the snapshot name on the left sidebar) has increased from 5.6 MB to 24.7 MB and there are some large numbers listed for shallow and retained size.
However hunting blind in any one snapshot doesn’t get you very far typically, where the DevTools comes into it’s own is with the comparison options.
The last option in the Memory Tab’s control panel is a dropdown which will state “All objects” by default. Clicking on this dropdown gives you a number of options to compare between snapshots.
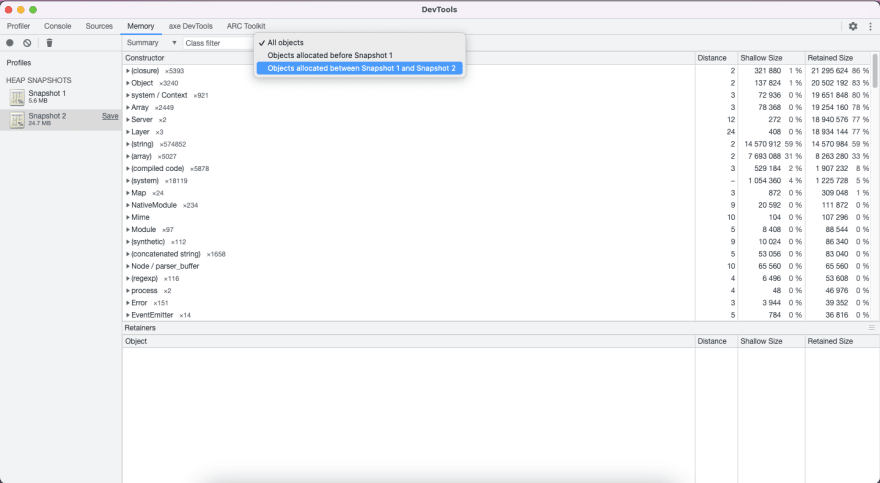
Here we select the “Objects allocated between Snapshot 1 and Snapshot 2” option to show us the delta between the two snapshots.
This immediately reduces the number of constructors in play when compared with the long lists for the individual snapshots — anything that hasn’t changed between the snapshots hasn’t been listed, removing a lot of the noise from the view.
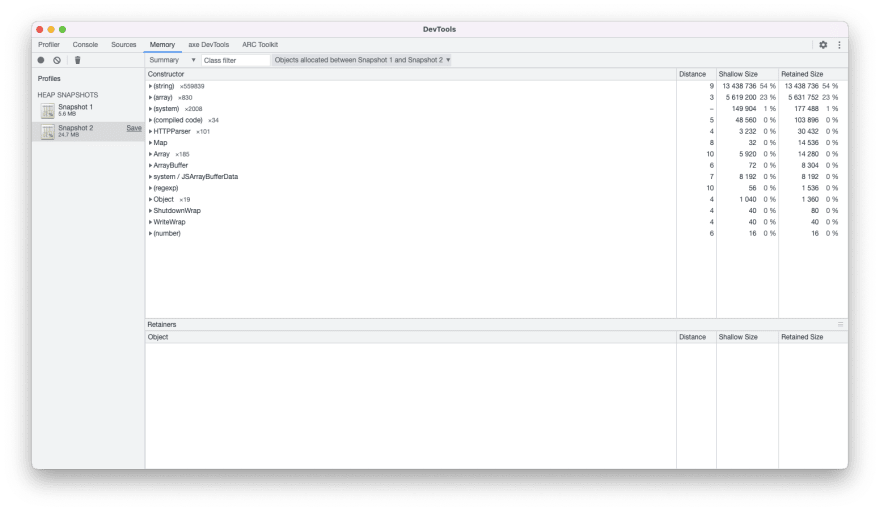
Now comes the interesting part — finding the source of the leak! We start by sorting the list by retained size (typically the default) and navigating down the list of constructors one by one. Here we expand the (string) options first and take a look:
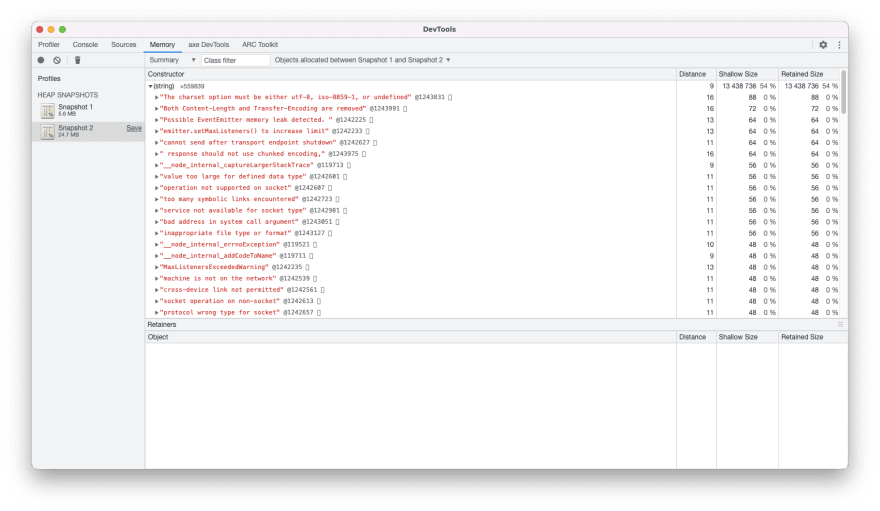
There’s nothing of interest here — we can tell from the small shallow and retained sizes of each of the strings listed that the issue doesn’t lie here. Although the combined size of each string does make for the largest sized collection, the size associated with each string is very small.
Intuitively we’re also not expecting a string to be the primary cause of our problem — nowhere in our logic are we growing a string (perhaps if we were doing some sort of string concatination, but we’re not). It’s apparent that a lot of these strings are likely long-lived constants, we likely took our first snapshot too early — if we were to take a third snapshot they would like be removed from the comparison view now the server has had some requests.
Moving onto the second constructor we can see something a little more interesting:
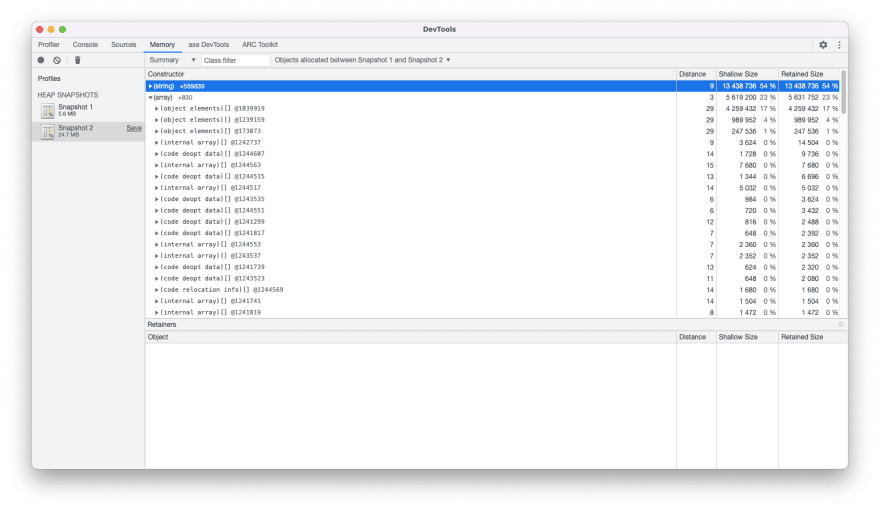
Here the shallow and retained sizes for the top three children are particularly large considering this is a delta!
Clicking on the first (object elements)[] row we can populate the “Retainers” bottom panel with detailed information on the object in question. This immediately points to a suspect:
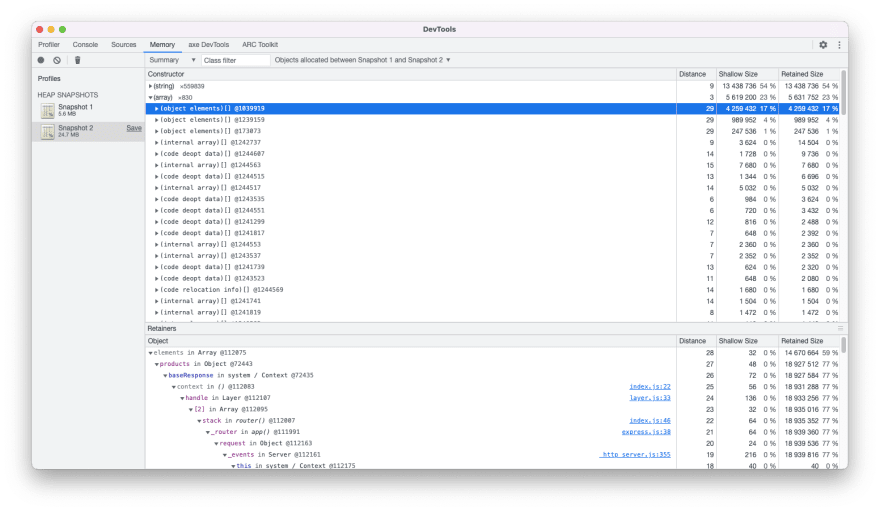
In the bottom panel we can see that the massive retained size has been associated with the elements in a products array that exists on a baseResponse object used by the Express middleware stack! If we click on the second and third child we can see that these are for subCategories and filters respectively.
Somehow these arrays on our baseResponse object are growing in size after requests. This must mean that they are being mutated with more and more values! In fact if we expand the (object elements)[] children we can see the exact values that are populating our arrays.
So our leak is something causing the baseResponse arrays to grow on a per request basis... let’s go have another look.
Want to learn more about debugging memory with Node? Checkout the Node Memory Diagnostics tutorial page.
When does a reduce grow?
Let’s take another look at our mergeResponses() method:
const baseResponse = {
  filters: [],
  products: [],
  subCategories: [],
};

function mergeResponses(responses) {
  return responses.reduce((finalResponse, response) => {
    finalResponse.filters.push(...response.filters);
    finalResponse.products.push(...response.products);
    finalResponse.subCategories.push(...response.subCategories);

    return finalResponse;
  }, baseResponse);
}
We’re reducing over the array of responses, accumulating the associated filters, products, and subCategories and return the result. And in doing so somehow the baseResponse is being mutated?
Well exactly that — TIL!
Turns out that although Array.prototype.reduce() does not mutate the underlying array it does mutate the initialValue if it is provided. In many cases where you might provide a value directly like a number or an empty object this is fine, but if you create a bootstrap object like we have here then it will get mutated by each call, and re-used every time!
This isn’t mentioned anywhere on MDN or similar from what I can find, so is a bit of a gotcha — though I suspect the number of times this pattern is used is likely (hopefully) small.
So how do we fix this issue?
Well one option is to move the baseResponse into the mergeResponses() method so that it is no longer in top level scope and can be garbage collected once the request has been responded to. I.e.
function mergeResponses(responses) {
  const baseResponse = {
    filters: [],
    products: [],
    subCategories: [],
  };

  return responses.reduce((finalResponse, response) => {
    finalResponse.filters.push(...response.filters);
    finalResponse.products.push(...response.products);
    finalResponse.subCategories.push(...response.subCategories);

    return finalResponse;
  }, baseResponse);
}
Or as we opted for, move away from a reduce when we’re fundamentally not changing object shape:
function mergeResponses(responses) {
  const baseResponse = {
    filters: [],
    products: [],
    subCategories: [],
  };

  responses.forEach((response) => {
    baseResponse.filters.push(...response.filters);
    baseResponse.products.push(...response.products);
    baseResponse.subCategories.push(...response.subCategories);
  });

  return baseResponse;
}
So did you spot the memory leak before the big reveal?
Have you got the same code in your apps? 😱
Have you faced a memory leak recently?
Let me know in the comments along with your thoughts, comments, and queries! Till next time folks 🚀

Top comments (0)