
This post was initially posted on my medium blog @dapseen
Working as a DevSecOps/SRE could be really fun, you know. The different kinds of errors tell you exactly where to go, yeah? It’s a 404 error — I’ll have to check my logs, check ELB (Elastic Load Balancer) status, I’ll…, bla bla… and yea, with that, i’d be able to determine if it’s a code error or a network error.
In more technical terms, it’s very common for DevSecOps/SRE to write promQL that monitors status 4XX, 5XX etc. However, what happens when you get none of these statuses?
What I mean is…
WHAT DO YOU DO WHEN YOUR SERVICE IS NOT AVAILABLE?
Don’t get me wrong guys, this is completely different from your service not running. What I mean exactly is — your service is running perfectly, but oops! it’s just not reachable.
To manage this kind of incident, checking logs for your regular 5XX or 4XX definitely wouldn’t work here. Why? Your service wouldn’t be logging any of these response statuses. Sadly.
Now let’s look on the brighter side. The question is, how can you monitor your service that is not reachable?
Simple!
Monitor SILENCE
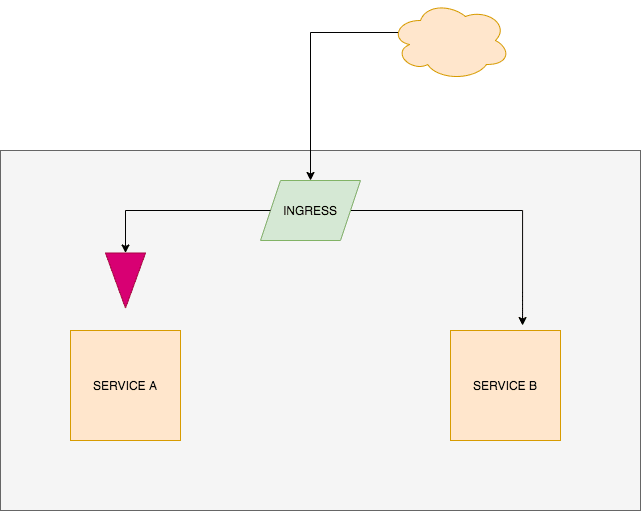
Service A on a regular day receives 5000 RPM (requests per minute) in peak hours. SILENCE comes into play when Service A is getting 0 (zero) RPM. Obviously, you know something is totally wrong.
Now to the main business…
Writing a well structured PROMQL to understand this and plugging Grafana to alert your slack channel is something i’d recommend.
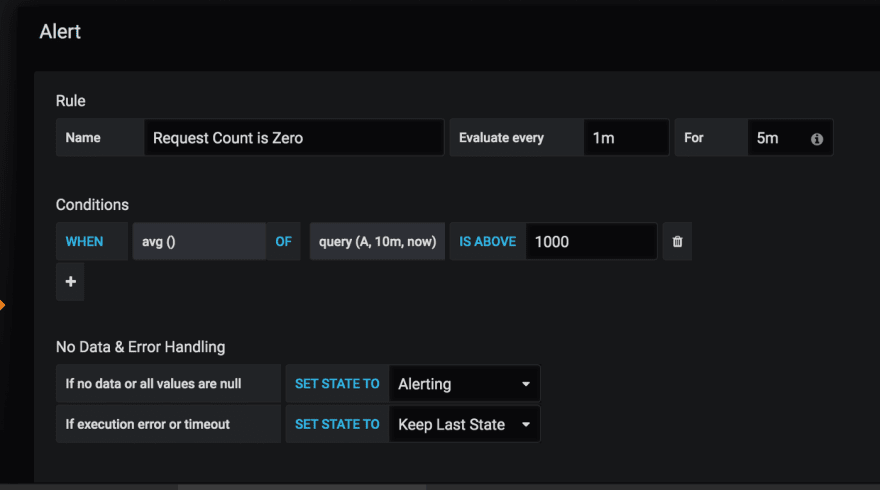
Setting if no data or all values are null to ALERTING will notify you when you don’t have any request hitting your service.
However, what i’m yet to figure out is — how can I prevent this from waking me up in the middle of the night when I get low traffic or zero traffic? That kind of SILENCE is valid, but peak hours SILENCE — Definitely NOT valid.

Top comments (0)