
In this article you'll find out how to 10x your development speed with local serverless debugging.
Questions such as "what happens when you scale your application into millions of requests?", "what to expect when going serverless?", "how does it look like?", or "how is it to build applications on serverless and work locally?" will be addressed.
In the development world, the ultimate goal is to increase the business value that you can add to your product. And that's the whole goal of this article---show how to increase development speed to reach that goal faster.

Serverless Development Speed
Let's dive into a little bit about serverless development speed. The thing that deters a lot of people from switching to serverless is the development of it.
You can compare it to a monolithic architecture, which once you get it into production is going to be hard to scale, hard to deploy, hard to maintain. But the nice thing about it is, it's not too bad to develop with. On the flip side with a microservice and a serverless architecture, you're really reaping the benefit of the cloud. The issue is all of your resources, your database, your S3 bucket, your Lambda functions are separated. That's not the easiest thing to develop locally, right on your computer.
And it can also be slower. That can slow down things because you really have two choices.
You can either upload to the cloud, when you want to make a change and then test it, see if it worked, or you can try to develop locally, but there is going to be a little extra setup involved. And so you really don't want to be deploying to the cloud every time you make a change, because you're going to have to wait 10 seconds to two minutes to maybe even five minutes for that to get uploaded. So if you're making those changes multiple times that's not going to be a good result. You're going to waste a lot of time there. So today we will hone in on what local development looks like, what that setup is like, and how to do that.
You've decided "okay, I want to use serverless but now I want to build out a project". Your next step is to decide which framework you want to use. This is not by any means an exhaustive list. This is more of what you could think about in your head as you go to build a serverless application. Think of the project in terms of experiment, all the way up to production.
If you just want to build a quick Lambda function, test it out. Use AWS SAM when building a mock-up website; you get a front end connected to a backend, maybe some Cognito, and Amplify is a great choice for that. And then up to the production level on serverless.
Learn more about optimizing AWS Lambda for production.
Serverless is great because it's cloud-agnostic. It is going to scale very well. Going forward, we will share examples and showcase what debugging a production workload would look like based on the Serverless Framework.
Best Practices for Debugging Serverless Locally
Let's talk about a couple of best practices before getting into a demo of what this looks like.
When you build out a function, one of the things you want to keep in mind is keeping prioritizing many small functions over one large function.
The reason for that is, down the road when you go to debug this thing, if you have one large function and you see, "okay, my application's broken, how do I go and fix that?"
You're going to pull up, you're going to go to your monitoring tool, for example, CloudWatch.
And you may find which function is broken, but then it's going to take you that much longer to figure out exactly where the issue is in your code, versus when you have lots of small functions, it's less code to go through when that error does come up. You can hone in on that mistake much quicker.
Find out how MangoMint -- an online Spa and Beauty appointment management tool -- managed to significantly speed up their serverless development cycles and team processes.
And then the second and last best practice to really hammer in today is iterating locally.
It's the idea that you can get many local iterations for one iteration by pushing your changes up to the cloud. The reason for that is there's this wait time for things to upload and to come back down. If you can set up your application to be able to do those cycles locally, that is absolutely what you want to do.
Three years ago Dashbird was created from the learnings of early adopters of serverless. Today Dashbird has over 5,000 AWS accounts connected and ingesting monitoring data. From this pool, it's possible to see current trends in building serverless as well as the main mistakes developers and organizations tend to make.
Let's look at serverless monitoring and debugging at scale:
- What are the key points to bear in mind and how to save time and reduce risk?
- Why is observability, monitoring, and debugging so hard in the cloud?
The number one reason is compared to containerized server-centric workloads, there are exponentially larger amounts of cloud resources to actually deal with. 10 servers turned into 500 functions for example.
All of those resources or functions have logs, metrics, traces, and a lot of distributed data sitting in CloudWatch logs. All with different configurations.
They interact with each other, and it becomes really difficult to understand how the application is used. For example, if there are any problems for any kind of debugging. Or if there's even a performance impact, or if something is slow or not working as intended.
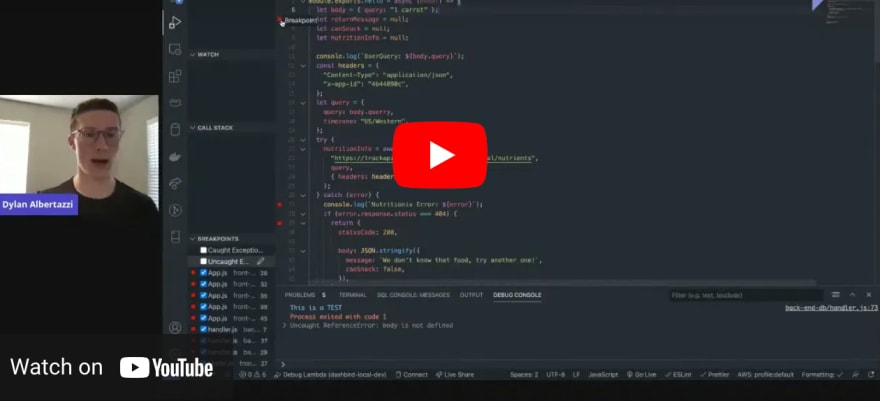
Local Serverless Debugging Demo
Serverless Monitoring & Debugging at Scale
First Challenge: Large Sets of Data
One challenge that comes up thousands of times over and over when building a serverless application is related to having too many resources.
Each of those resources has a lot of data that they're producing. It's a lot of things to keep on top of to understand and to be able to effectively navigate around. This challenge can be divided into three categories that will be introduced below.
But first, what are the ways of approaching observability?
The monitoring data grows exponentially. It's locked away in silos, there's a lot of noise, and signals are hidden in that noise. A lot of structured or unstructured monitoring data can be hard to translate into meaningful data like:
- What's the cost?
- What's the changes in the latency?
- What are the business events like?
- How many kind of signups do you have
- How many payments are going through the systems?
To solve this, let's take a step back.
What does observability mean? The definition is that it's a measure of how well the internal states of a system can be inferred from knowledge of its external outputs. In the context of serverless monitoring, the idea is: can we understand the state of our application by analyzing all of the external outputs that the system is outputting or telling us?
Serverless applications have observability. All of your services, if they are business serverless, can be understood by looking at various data sources across the cloud environment. There's arguably nothing you cannot really understand if you're using those services. They are producing data. You have metrics, which are the most basic indications of what's going on in the application. You have logs for each event. Each location gets logged if you have an exception or a timeout or anything relevant in the events or any application events. And X-Ray will automatically trace requests across the environment. You have to have an API Gateway request that goes into a function that perhaps goes to another function that goes into DynamoDB, and SQS, etc.

X-Ray is a service that gives you a trace of that single execution. It also gives you a service map that illustrates how the different resources of your cloud environment are interacting with each other. Additionally, there are CloudTrail access logs that basically log out API requests within your AWS so you can see what services were accessed.
Another thing to be mindful of is all of the resources have configurations and those configurations can change. This includes the memory provisioning Lambda functions, the timeouts, the security of your API Gateways. Questions like "are they using authorizers?", or "what integrations are they using?" and "do they have logging enabled?" should come up. All of those kinds of signals are also driven from the configuration side. If you put this all together, you will have quite a good understanding of what's going on, in theory.
The problem is that looking over all of this data, working with it, setting alarms, and really getting an overview of what's going on is incredibly difficult at scale.
It also requires a ton of customization, learning, and research.
So the next step for an organization that is scaling on serverless is really thinking about how to make the data of your application activity available to the users or to the developers. Can you answer these questions quickly and easily?
- Can you effectively search logs or query metrics?
- Do you get an understanding of a microservice level health or activity of a logical business unit?
- Can you understand how your users are actually experiencing the applications?
- How many requests a single endpoint gets?
- How much is one or the other feature used?
- What's the latency of different parts of your application?
Try to get an understanding of the cost and the failures of the system, and think about how to do that quickly so you don't spend two days out of the five-day workweek going through that kind of a load of data.
That's the first problem you should be looking towards. Dashbird is one of the services that does that by first mapping the entire cloud environment, and then automatically ingesting all of the data into one place. This makes it easy for anyone to interrogate queries, look at microservice level data, or accountable data.
There are different tools in the market that also do this. But it's been proven within the last three years that Dashbird helps companies succeed with serverless beyond a certain scale.
Second Challenge: Variety of knowns and unknowns
The second challenge comes up when you start scaling on serverless. It is the large variety of known and unknown things that can happen to your application to make it not work or to not perform efficiently.
Imagine this scenario: 500 functions and a bunch of different DynamoDB tables, API gateways, SQS queues. They can become slow, run out of memory, time out, have code exceptions, etc.
So what happens when an organization scales? All of those scenarios need to be somehow monitored. So when anything happens, you would get an alert or at least know about the problem. Then your users wouldn't be the ones telling you that, "Hey, this is actually broken."
Again, the problem is how do you analyze the signals across all of those different data sources?
The solution is developing an alert management strategy for your metrics, your logs, possibly even configuration changes like a harmful change in the configuration of your function. Another example of a situation that you should be alerted on is a change in the IAM policy---for instance, if there is too much risk within the access policy of a function. Think about all those types of changes that can affect customers.
Dashbird's automated pre-configured alerting system will look at your metrics, all you have to do is set the SLA, SLO, SLI and everything else will be taken care of for you.
The number one thing you can do is reduce the time it takes to know about those types of failures, so you can quickly take proper action. The other thing with alerting is you need to get confident in doing deployments and iterations. It's especially important with the product updates and launching new versions with minimal risks.
If you launch any feature and then it breaks in the first five minutes, then over time it weighs on your confidence to make changes. But if you have proper alerting---if you get to quickly react to any failures, then the confidence level increases as well. There are obviously different types of deployments where you can only release some feature for 10% of your user base at first and then go from there.
Users actually aren't aware of the number of different failures they have on their system. It's because at times those are really hard to notice, and might even go unnoticed for years.
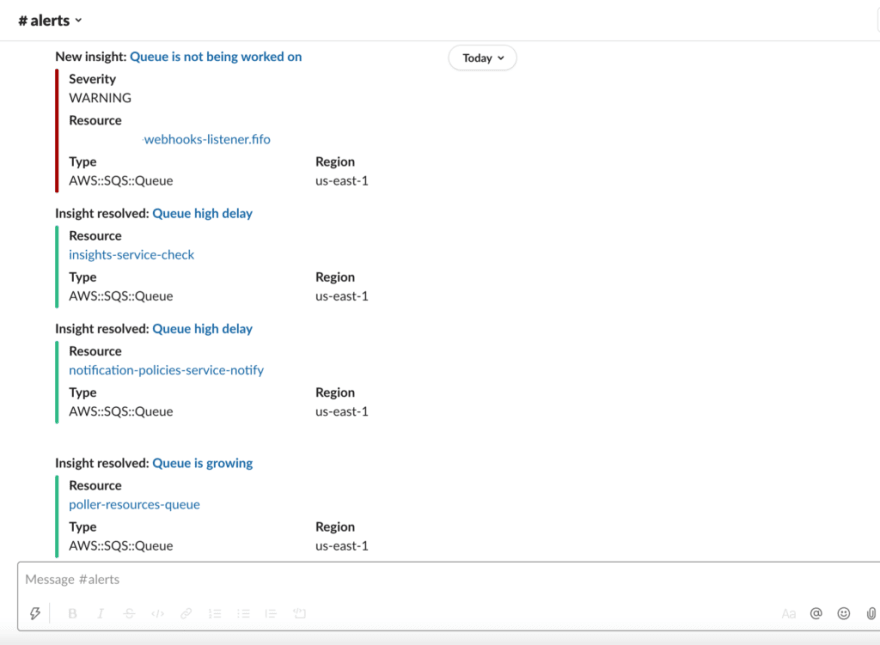
Dashbird alerts you immediately via slack or email if there's an error or if anything is about to break.
Define the expectations for your application---SLAs like how fast should direct endpoints be? What are the levels of failures you will allow in your function executions? How long is it acceptable before you have to fix it?
If you think about* what are the expectations and what you need to achieve, and also have the ability to enforce those alarms*, you're all set to scale.
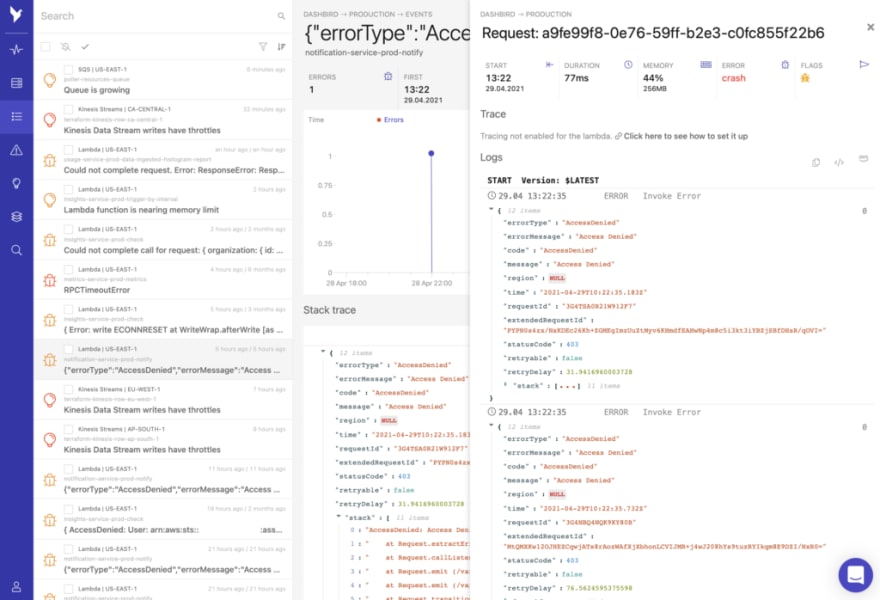
Definitive Ways to Analyze Data
Dashbird analyzes a lot of that data on the fly. From logs, metrics, and configuration data continuously. For example, if you have any sort of crash timeout or anything across any of the metrics, not just functions, but databases, queues, streams or in your Lambda logs, then those would be caught immediately. Today there are 80 pre-built checks across different parts of your application.
One alerting trend that is gaining momentum is doing it programmatically. There are ways you can configure alarms in your cloud formation. Automation and using APIs is a good practice to have because it scales and it's enforced across one microservice. However, if you have it as a policy in your organization then all of the teams that are building different microservices will be on top of having a mature alert coverage for your infrastructure.
The Third Challenge: Security, Compliance, Performance, and Best Practices
That brings us to the third challenge. You have observability---you have the ability to understand your application and can analyze the activity there. You can quickly debug and troubleshoot. You will instantly know if something goes wrong.
Now, the last but not the least important things. Managing security, compliance, performance costs, and overall best practices.
Going back to the proliferation of stacks, hundreds of resources---the risk here is what if you have an outdated Lambda function somewhere that has a lot of permissions to make queries or use your AWS APIs; it can access whatever databases. Imagine an attacker somehow gains access to it. Maybe it has outdated packages or some other scenario. What if something goes haywire and starts costing you a lot of money? Imagine your DynamoDB scales up due to a malicious rogue function that is hitting it all the time?
All of those different risk management, reliability management, cost management aspects can become challenging at scale. And depending on the sector and the product you need to de-risk your environment and continuously audit it for risk.
The best place to start here in my opinion other than common sense is the AWS Well-Architected Framework. So this provides you with the five pillars. It's a 70-page white paper, and it has lenses as well. It has a machine learning lens, a serverless lens, and an IoT lens. And they're coming up with more lenses.
It's a good resource to go over to understand, internalize, and evaluate your system. The reality with serverless is that you have so much to work through that having something on paper or having the knowledge can become difficult.
Automation here is definitely really important. Other than the Well-Architected Framework, there's tons of knowledge in the community. There are different Slack groups and Discord groups. There's a lot of knowledge out there, but it's hard to apply that to real-world environments.
The other thing that's quite hard within organizations is that even if you or a couple of people know, it doesn't mean that 10 or 20 other people in your team actually know about the best practices and the security aspects of different services. It's also hard to transfer the knowledge across the team and to continuously kind of enforce those best practices.
Regarding the Well-Architected Framework---there's a Well-Architected Labs. You can go into the labs and you can do tutorials and walkthroughs by yourself. Those give you a firsthand experience of securing applications or evaluating your applications for risk. It's completely a free source.
In serverless specifically, there are a lot of different common violations. One of the most common ones is abandoning resources and those resources can basically be an attack opportunity, an attack surface. So don't forget those functions. If you have functions that are a couple of years old, you might want to look at the packages and update everything about them. There's a lot of waste in serverless but database provisioning, Lambda function, memory provisioning---don't wait in code.
Back up your databases. It's been really easy now I think for the past year. If you're running something that shouldn't fail or if it fails you can go back and look at what happened.
Logging and detail monitoring for API gateways is always recommended. Maybe just the failures part because otherwise, it can be too expensive in your coverage. The fifth most common thing is people not tagging their resources, and not having clear naming conventions. That leads to confusion as well.

Dashbird automatically checks your whole infrastructure against the five pillars of the Well-Architected Framework's best practices and gives you actionable tips on improvements.
Dashbird has over 100 checks that we continuously run against your resources to basically identify all of those things above. We're adding more every day.
A Recap on Operational Excellence

Three pillars to add scale monitoring approach for serverless.
Observability---get all of the data into one place, understand the users, reduce overhead for development teams.
Detect your failures early on. Don't let your users notify you that your app isn't working. Define the custom conditions to your business or your application and configure them as well.
If nothing shows up then it means everything is okay and then manage the posture and security. This is a bit of a more complex one and it's a more abstract proposition but definitely as soon as possible if you are scaling. Think about security, reliability, cost, and there are a lot of good ways to do that.
Further reading:

Top comments (0)