
Bugs are an inevitability in programming, and Python is no exception. Learning how to properly use debugging tools in Python can be a great way to boost your productivity as well as the quality of your work.
Furthermore, debugging is considered an essential skill for any programmer. If you're just getting started with Python development, then you should definitely learn to debug in an IDE, or with the Python debugging module. Learning how to use better tools and techniques for debugging in Python is a lot more straightforward than it may seem. Python has a large and passionate community, so there are lots of great options for debugging your code.
Today, we'll be going over some debugging basics, guide you through setting up the Python debugger module (pdb), cover some other ways to debug your code, and then wrap up with some extra resources for you to explore.
We'll cover:
- What is debugging?
-
How to get started with the Python
pdbmodule - Handy reference sheet for pdb commands
- More ways to debug in Python: IDEs
- Wrapping up and next steps
What is debugging?
The goal of debugging is to ensure that your code is free of any errors and issues that may jeopardize the performance of the program. There are two main types of bugs in programming, syntactic errors and semantic errors.
Syntax errors occur as a result of spelling or punctuation errors in the source code, incorrect labeling, failure to define variables and functions, etc.
Here's an example of a syntax error in Python:
# Replace "raccoon" with "ferret" in this list
housepets = ["cat", "dog", "bird", "raccoon"]
housepets.pop()
housepets.append("ferret")
print(hosepets)

----> Traceback (most recent call last):
  File "main.py", line 5, in <module>
    print(hosepets)
NameError: name 'hosepets' is not defined
The code fails to run because print(hosepets) should be spelled as print(housepets) instead.
Semantic errors happen when your program can run successfully but behaves incorrectly.
In this example, the code uses the clear() method, which removes all of the animals in the housepets array instead of just the raccoon.
# Replace "raccoon" with "ferret" in this list
housepets = ["cat", "dog", "bird", "raccoon"]
housepets.clear()
housepets.append("ferret")
print(housepets)

----> ['ferret']
So even though this program runs, it still isn't achieving the desired effect.
As you can imagine, mistakes like this are pretty common. That's why virtually all programming languages (and most popular IDEs) support debugging as a standard feature.
What does a debugger do?
Debuggers are diagnostic tools that allow you to see the execution state and data of a program as it's running. In other words, you can define the point at which your Python program needs to be stopped and then suspend execution. By suspending your program, you can go in and find information about variable values, the current state of threads, objects currently in the heap, and more.
Don't rely solely on print()
It would be remiss of me to write an article about debugging without bringing up print(). Many Python beginners and self-taught Python programmers use print() calls to debug their code. Using print() is a quick and easy way to see if a variable is being assigned its expected value.
However, placing print() calls after every variable to identify where your bugs are is inefficient, and can get unmanageable with larger bodies of code.
Here's an example of how you might use the print() statement to debug. Try uncommenting the print statements to see where this code went wrong.
fifteen = 300/45
#print(fifteen)

ten = 10
#print(ten)

five = 5.0
#print(five)

sum = fifteen + ten - five
#print(sum)

x = "The sum is equal to 30! "
print(x)
print(sum == 30)

----> The sum is equal to 30!
False
Here the program is running, but not achieving the desired result.
If you were working with more than a few variables, checking all of their values using print() would quickly become tedious.
How to get started with Python's pdb module
What is the pdb module?
The pdb module is a standard debugger that comes with all versions of Python. So, if you already have Python installed on your machine, you already have pdb. Pdb supports setting conditional breakpoints, single-stepping at the source line level, inspecting stack frames, source code listing, and evaluations of the Python code in the context of the stack frame[1].
Pdb is a great place to start because it's a very basic debugger. It's great for small to medium-sized projects, and you can add different extensions (like pdb++) to make it more useful.
How to start the debugger
You can start the Python debugger in a few different ways. First, you can import and start it with a single line of code.
import pdb; pdb.set_trace()
Another way is to import the debugger into Python's Integrated Development and Learning Environment (IDLE) and have it run your module.
You can also call the debugger on the command line. Here’s a mini-tutorial on how you can do just that.
Using the command line:
First, open up a terminal (command line window) and navigate to the program that needs debugging.
Next, import pdb and your module, then execute pdb's run() method to call the module's main method.
import pdb
import example.py
pdb.run('example.main()')
<string>(1)<module>()
(Pdb) continue
This will pull up the debugger's prompt, where you can type continue or c to proceed with running your program. By continuing, the debugger will keep executing the program until it reaches a breakpoint or the script ends.
You can also start the debugger by executing the following command in your terminal:
python -m pdb example.py
If you're using Python 3, then use this:
python3 -m pdb example.py
Single-stepping your Python code
Single-stepping is the process of going through your code one line at a time. You can use the step or s command to do so.
C:\Users\yourname>cd c:\debugging101

c:\debugging101>python -m pdb example.py
> c:\debugging101\example.py(2)<module>()
-> def main():
(Pdb) step
> c:\debugging101\example.py(4)<module>()
-> def doubler(a):
(Pdb) s
> c:\debugging101\example.py(9)<module>()
-> for i in range(1,10):
In lines like c:debugging101\example.py(4)<module>(), the number inside of the parentheses indicates the line where the error is. You can use args or a to print the current argument list to the screen. Another useful command to know is the jump or j command followed by a space and the line number you want to move to. This allows you to skip straight to the line you want.
Setting breakpoints
A breakpoint is a line in the code where you want to pause execution. You can set breakpoints by calling the break or b command followed by a space and the line number you want to break on. If you want to specify a breakpoint in a different file, you can prefix the line number with a filename and colon.
In addition, you can use the break command without an argument to display all breakpoints in the program. If you use the break command with a function as an argument, it will set a breakpoint at the first executable statement within that function.
If you want to set a temporary breakpoint that gets automatically removed when hit, you can use tbreak.
In this example, we've set the breakpoint on line 6.
c:\debugging101>python -m pdb example.py
> c:\debugging101\example.py(4)<module>()
-> def doubler(a):
(Pdb) break 6
Breakpoint 1 at c:\debugging101\example.py:6
(Pdb) c
> c:\debugging101\example.py(6)doubler()
-> result = a*2
From there, you can use the args or a command to print the argument list to the screen.
Handy reference table for pdb commands
There are some useful debugger commands to know. If any of your variable names are shared with the debugger commands, simply add an exclamation point ! before the variable to distinguish them from each other.
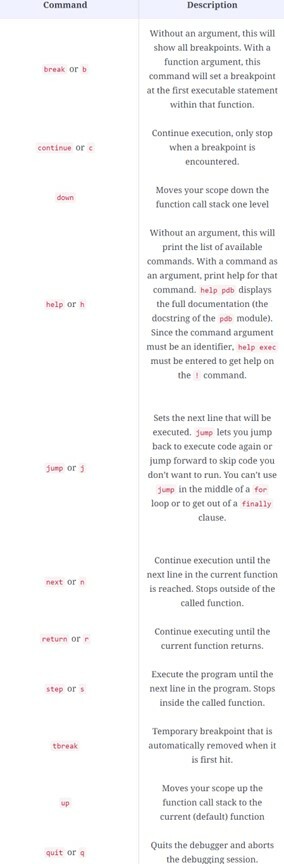
These commands were sourced from the official documentation for the Python Debugger[2]. Check it out for a more extensive list of commands!
More ways to debug in Python: IDEs
Pdb is a command-line debugger, but many IDEs include debugging tools that are more visually appealing and sometimes easier to use.
PyCharm
One of the best IDEs for working in Python is PyCharm by JetBrains. PyCharm was developed specifically for use with Python! As a Python IDE, you can expect PyCharm to cater to Python-specific needs. PyCharm also supports classic debugging features like breakpoints and single-stepping.
You can start a debugging session by launching your program with the debugger attached to it. Its debugging tool features dedicated panes for frames, variables, and watches, as well as the console, where it displays input and output information. So, instead of typing in a command to add breakpoints and step through your program, you can just click the button for that action instead.
Note: PyCharm has both a debug toolbar and a stepping toolbar.
PyCharm has a free, open-source version available. However, you will need to upgrade to their professional version if you want to get access to features like database support, remote development support, duplicate code detection, and more.
Visual Studio Debugger
Microsoft Visual Studio (VS) is another full-featured IDE, but one that was designed to support many different programming languages and is free for both professional and personal endeavors. The VS IDE includes a code editor, VS Code, which has an intuitive and easy-to-use interface. Beginners may find it easier to navigate Microsoft’s VS IDE than PyCharm.
You can debug a Python file through the code editor by clicking Run -> Start Debugging or pressing F5 to run the current file you're in. Like PyCharm, VS Code also supports the use of breakpoints and single-stepping, but it has the added benefit of a terminal emulator that allows you to work in any shell installed on your computer. So, if you want to work in Linux, that’s absolutely an option.
VS Code also makes it easy to configure your debugging process in the settings as needed and provides support for different Python libraries.
Both PyCharm and Visual Studio provide excellent support for Git and GitHub.
Wrapping up and next steps
By now you may have a better idea of what debugging is, the limitations of using print(), and hopefully, a little more familiarity with some popular Python debugging tools. There's no one-size-fits-all procedure for debugging, so you should explore what tools and techniques are right for your project.
It's always great to see the Python community grow, and we hope that you'll develop the skills you need to become an amazing programmer.
With so many fantastic applications for Python, it's always exciting to see how people learn and apply Python in new areas. At Educative, we love supporting people who are eager to learn! So, we'll always be working hard to give you the resources you need to become an amazing programmer.
To get more Python content delivered right to your email inbox, check out our Grokking Python newsletter on Substack!
To help you master Python, we've created the Python for Programmers learning path.
Happy learning!
Continue learning about Python on Educative
- A complete guide to web development in Python
- 50 Python interview questions and answers
- Level up your Python skills with these 6 challenges
Start a discussion
What else do you hope to learn about Python? Was this article helpful? Let us know in the comments below!

Top comments (0)