When it comes to deploying applications in Kubernetes, it's like having your own Swiss Army knife; you've got a tool for every task. That's where Terraform and Helm come into play, joining Kubernetes to form a mighty trio that can tackle both infrastructure provisioning and application deployment with finesse.
In this post, I’ll demonstrate how these three tools come together, using env0 to create a unified platform that combines Kubernetes scalability with Terraform's provisioning strength and Helm's deployment dexterity.
Terraform, Kubernetes, and Helm: Better Together
The advantage of using Terraform, Kubernetes, and Helm together lies in their synergy, with each tool playing it own part:
- Terraform excels at setting up and managing the infrastructure that Kubernetes runs on, especially with services such as AWS EKS.
- Kubernetes provides the orchestration and management layer for your containerized applications, ensuring they run as intended.
- Helm takes over the application deployment aspect, making it easy to package, deploy, and manage applications in Kubernetes.
Granted, Terraform can deploy applications directly into Kubernetes clusters using its Helm provider, so technically speaking, you can manage both your infrastructure and applications through Terraform scripts.
However, for more effective lifecycle management of applications, it's advisable to keep the responsibilities of infrastructure setup and application deployment distinct, because:
- It aligns with the best practices of modern development, allowing for a clear division of concerns and making it easier to manage changes and updates between teams.
- It establishes a seamless workflow with Terraform, used to automate the creation of Kubernetes clusters, Kubernetes serving as the runtime environment, and Helm working to streamline the deployment process.
- It enables us to use Kubernetes-native tools (in our case, Helm), that are finely tuned to “understand” Kubernetes' architecture, offering the ability to perform rollbacks, conduct easy updates, manage application releases effectively, etc.
How to Streamline Kubernetes Deployments with env0
Requirements
- A GitHub account
- Access to an AWS account
- An env0 account
TLDR: You can find the main repo here.
Note: Terraform can deploy applications directly into Kubernetes clusters using its Helm provider or its Kubernetes provider, so technically speaking, you can manage both your infrastructure and applications through Terraform scripts. However, you will find this tedious and not as efficient, and also not aligned to the k8s best practices I describe below.
Integrating Terraform and Helm with env0
Now let’s jump into a demo in which we’ll use Terraform to provision a managed Kubernetes cluster in AWS (EKS) and then utilize Helm to deploy the Prometheus and Grafana applications, with env0 providing the common workflow for both, like so:
For further reference, below is our repo's folder structure. Notice that we have a folder that contains all of our Terraform configuration files.
├── LICENSE
├── README.md
└── Terraform
    ├── main.tf
    ├── modules
    │   └── eks
    │       ├── LICENSE
    │       ├── README.md
    │       ├── main.tf
    │       ├── outputs.tf
    │       ├── variables.tf
    │       └── versions.tf
    ├── outputs.tf
    ├── terraform.tfstate
    ├── terraform.tfstate.backup
    └── variables.tf

3 directories, 13 files
EKS cluster provisioning with Terraform template
Let's start by creating a new project in env0 and calling it Env0-Kubernetes-Prometheus-Grafana.
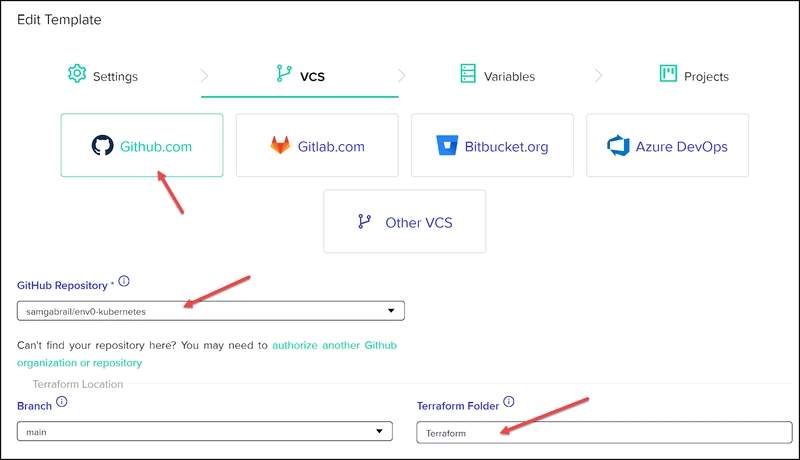
Next, create a Terraform template for setting up an EKS cluster. Head over to the Templates tab on the left navigation bar create a new Template of type Terraform and fill out the fields as required.
Select the GitHub Repo and remember to select Terraform in the Terraform Folder field.
You won't need to fill out anything in the variables tab. Finally, add this template to the project.
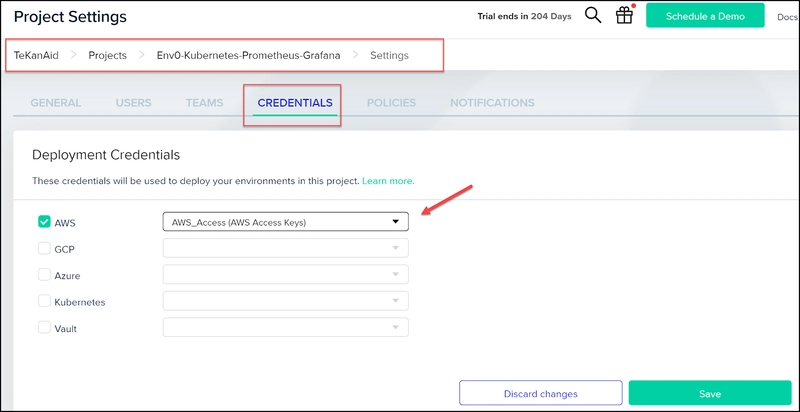
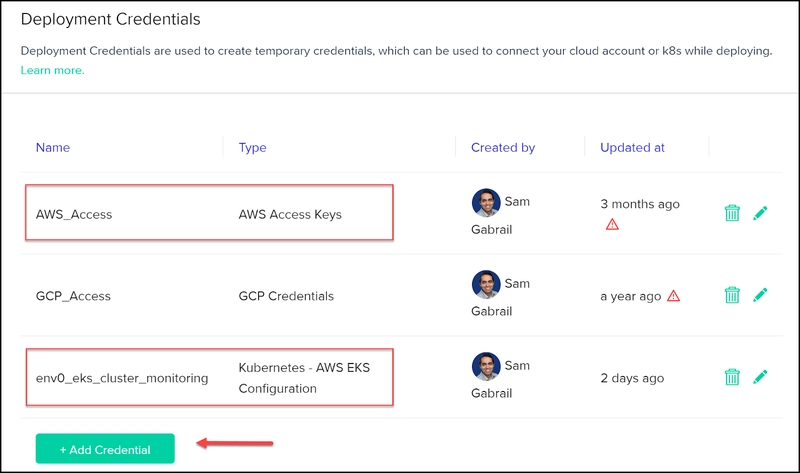
Make sure to add your AWS credentials in the organization settings and then reference them in the Credentials tab in the Project Settings section.
Now go ahead and create a new environment referencing this newly created template from the Project Environments tab within your Project.
Of course, you will need to approve the Terraform plan before the terraform apply could run. This process will take over 20 minutes so grab a coffee while you wait for your cluster, or continue with the Helm templates below.
Application deployment via Helm template
It's now time to create our Helm templates in env0 for both Prometheus and Grafana.
1. Create the Helm templates in env0
Similar to what we did for the Terraform template, do the same for Prometheus first then Grafana.
Note that now we will select the Helm template and under the VCS tab, you will need to reference the Helm Repo and specify the Helm chart repository along with the Helm chart version and chart name as shown below for Prometheus.
And here is what it looks like for Grafana:
Once again, you won't need to fill out any variables. If you need to modify the values file for the helm release you can add Environment variables in env0, but we won't need that for our demo.
Make sure to add these two templates to your project.
2. Add k8s cluster credentials
Once the Environment we created with Terraform is complete and the EKS cluster is created, we can add the Kubernetes credentials as shown below:
Notice that the cluster name needs to match the cluster name we created in EKS and needs to be in the same region. You can read more about this in env0's documentation.
Your project Settings page and the Credentials tab should look like the image above.
3. Use Helm templates to create two environments
Now we can create two more environments in our project using the two Helm templates we created.
This will deploy our Prometheus and Grafana applications. Just make sure to leave the Namespace field empty as shown below and give a name to the release. This will deploy the applications to the default namespace in our Kubernetes cluster.
4. Review project environments
By now you should have three active environments: one from the Terraform template and two from the Helm templates, as shown below.
Also, your organization templates should look like this:
4. Connect the EKS cluster
From the Grafana or the Prometheus environment deployment log, you can find the aws cli command to access the cluster:
aws eks update-kubeconfig --name env0_eks_cluster_monitoring --region us-east-1
Let's run some commands from our cli to check on our cluster. Get the nodes:
(⎈|arn:aws:eks:us-east-1:706933696988:cluster/env0_eks_cluster_monitoring:default)
sam@Sam-Office-Desk:~/Development_Linux/customersenv0/env0-kubernetes/Terraform$ kubectl get nodes
NAME                         STATUS   ROLES    AGE    VERSION
ip-10-0-1-80.ec2.internal    Ready    [none]   168m   v1.27.9-eks-5e0fdde
ip-10-0-3-168.ec2.internal   Ready    [none]   168m   v1.27.9-eks-5e0fdde
Check the running pods. You can see Grafana and Prometheus pods running.
$ kubectl get po
NAME                                                READY   STATUS    RESTARTS   AGE
grafana-9dd4b466b-r5sfx                             1/1     Running   0          145m
prometheus-alertmanager-0                           1/1     Running   0          146m
prometheus-kube-state-metrics-58bc485699-kvj4t      1/1     Running   0          146m
prometheus-prometheus-node-exporter-jg8np           1/1     Running   0          146m
prometheus-prometheus-node-exporter-jq9p5           1/1     Running   0          146m
prometheus-prometheus-pushgateway-f4557d877-dzf29   1/1     Running   0          146m
prometheus-server-5478d946bc-j2nx6                  2/2     Running   0          146m
Check the Helm charts installed.
$ helm ls
NAME            NAMESPACE       REVISION        UPDATED                                 STATUS          CHART                   APP VERSION
grafana         default         1               2024-02-08 16:37:43.667592038 +0000 UTC deployed        grafana-7.3.0           10.3.1
prometheus      default         1               2024-02-08 16:36:32.470600452 +0000 UTC deployed        prometheus-25.11.0      v2.49.1
Check the status of the Grafana chart to retrieve the initial admin password.
$ helm status grafana
NAME: grafana
LAST DEPLOYED: Thu Feb  8 16:37:43 2024
NAMESPACE: default
STATUS: deployed
REVISION: 1
NOTES:
1. Get your 'admin' user password by running:

   kubectl get secret --namespace default grafana -o jsonpath="{.data.admin-password}" | base64 --decode ; echo


2. The Grafana server can be accessed via port 80 on the following DNS name from within your cluster:

   grafana.default.svc.cluster.local

   Get the Grafana URL to visit by running these commands in the same shell:
     export POD_NAME=$(kubectl get pods --namespace default -l "app.kubernetes.io/name=grafana,app.kubernetes.io/instance=grafana" -o jsonpath="{.items[0].metadata.name}")
     kubectl --namespace default port-forward $POD_NAME 3000

3. Login with the password from step 1 and the username: admin
#################################################################################
######   WARNING: Persistence is disabled!!! You will lose your data when   #####
######            the Grafana pod is terminated.                            #####
#################################################################################
Retrieve the password.
$ kubectl get secret --namespace default grafana -o jsonpath="{.data.admin-password}" | base64 --decode ; echo
iyFssztHAvyoXr6w1Q5uDTMxmoDcNr74kbmaPyKZ
Expose port 3000 on your host machine to access the Grafana dashboard.
$ kubectl port-forward svc/grafana 3000:80

Forwarding from 127.0.0.1:3000 -> 3000

Forwarding from [::1]:3000 -> 3000
5. Access the Grafana dashboard
Now let's connect Grafana to Prometheus. First, we'll need to log in. Go to http://127.0.0.1:3000 in your browser and you'll be greeted with the login page for Grafana:
6. Connect Prometheus as a data source for Grafana
Next, go to the Data sources tab under Connections on the left navigation bar to add Prometheus as a data source for Grafana. Make sure to use the Prometheus server URL of: http://prometheus-server then click the Save and Test button at the bottom.
7. Run a query to test
Let's finally run a query in Grafana to see that the application is working. Go to the Explore tab on the left navigation bar and select a metric. I selected node\_memory\_Active\_file\_bytes as an example. Then hit the blue button at the top right called Run Query_._ You should get a graph at the bottom showing that our application is working.
Congratulations!! You've just automated the process of creating an EKS cluster with Terraform and deployed a monitoring stack into the cluster using Helm charts. Moreover, this was all done with one platform, env0, that offers the same workflow for infrastructure provisioning and application deployment.
Clean-Up
You can simply destroy the environments in reverse order of how we created them. So go ahead and destroy the Grafana and Prometheus environments, then the Terraform one. That will clean up everything nicely for you.
Best Practices for Kubernetes Deployments
In the above demo, we saw how env0 stepped in to make managing Kubernetes infrastructure and application deployment a breeze. By providing a cohesive environment for leveraging Terraform and Helm, env0 ensures your deployments are streamlined and efficient.
Here is how this plays into general Kubernetes best practices:
1. Embracing a Layered Deployment Strategy
env0 amplifies the effectiveness of using a layered deployment strategy. By managing Terraform for infrastructure and Helm for applications through env0, you establish a clear division of responsibilities. This not only aids in maintenance and updates but also ensures that each layer is optimized for its specific role in the deployment process. env0's dashboard and automation capabilities provide a unified view and control over these layers, making it easier to manage complex Kubernetes environments and Kubrenetes resources.
2. Streamlining Costs and Performance
With env0, you can monitor and optimize your deployments directly. env0 provides insights into resource utilization and costs, helping you make informed decisions on scaling and optimizing your infrastructure for both performance and cost-effectiveness. This means you're not just deploying efficiently with Terraform and Helm; you're also continuously improving your deployments based on real-world data.
3. Enhancing Security and Compliance
Leveraging env0's capabilities ensures that security is baked into your deployment process from the start. With env0, you can enforce policies and ensure that every deployment adheres to your security standards, including the use of minimal base images, implementing RBAC, and encrypting sensitive data. env0's policy enforcement ensures that your Kubernetes resources and deployments are not just efficient and cost-effective, but also secure.
4. Seamless Workflow Integration
env0 integrates into your existing workflows, connecting with Terraform to automate Kubernetes cluster creation and with Helm to streamline application deployments. This establishes a seamless workflow where infrastructure creation, application deployment, and management are all automated, reducing manual errors and saving valuable time.
Conclusion
To wrap up: leveraging env0 alongside Terraform and Helm not only aligns with but also enhances best practices for managing Kubernetes resources and deployments. From embracing GitOps to optimizing for cost and performance, and ensuring a secure, layered deployment strategy, env0 acts as the linchpin that brings it all together. It’s about making your Kubernetes deployments not just possible, but efficient, manageable, and aligned with the best practices that drive modern cloud-native development.
By integrating env0 into your Kubernetes deployment strategy, you're not just following best practices; you're setting a new standard for excellence in deployment and management, ensuring your infrastructure and applications are as robust, efficient, and secure as possible.


Top comments (2)
IMO this is just a glorified advert for env0.
So how would I do this without env0?
You make a fair point - orchestrating Terraform, Kubernetes and Helm without env0 is doable if you prefer the DIY route. But we think env0 simplifies that whole workflow nicely. Why not give our free plan a spin and see for yourself? app.env0.com/login