
As software (and the cloud) eats the world, more companies are using more microservice architectures, containerization, multi-cloud deployments and continuous deployment patterns. That means more points of failure. Failures, along with tight Service Level Objectives, stress out operations/SRE/DevOps teams, in turn increasing friction with development teams that want to deploy new features and launch new A/B tests as soon as possible.

CI/CD patterns have evolved a lot in the cloud era, helping teams to push improvements, fixes or new features to production almost instantaneously, giving users access to the latest goodies. One thing that enables this is the wide range of tools that both generate and collect information from running applications in real-time or near real-time.
This information is in the form of signals indicating an application's health, performance and conformity. You can observe and analyze signal anomalies to catch misbehaving applications or features that need to be patched or disabled until further analysis. If you do it properly, you can detect anomalies more quickly, meaning happier customers, prevention of major outages and fewer security leaks.

A disembodied hand coming from a screen like the girl from the Ring is another way to make customers happy
Back in the old days, signalling methods started as humble error/exception logging. They've now evolved to the latest OpenTelemetry standard.
In this post we’ll explore the new tracing and monitoring features introduced in Jina 3.12, and use Sentry to track what’s happening when indexing or searching.
What problems can monitoring and tracing solve?
We're going to use a fake real-world person to help explore the monitoring and tracing landscape: Meet Pamela NoLastName: She started a website called Pamazon to help people buy products online. Let's walk through the evolution of Pamazon.

Pamazon 1.0: Logs as stdout
As Pamela's site grows, she needs monitoring to generate, capture and analyze signals and improve site reliability. She starts with a pretty simple system:
- Application logs are stored on each local machine and rotated periodically to avoid using up all the available disk space. If Pamela wants a longer retention period, she has to export these logs.
- If a customer or tester notices an anomaly like the search engine constantly timing out, they create a support ticket to complain.

- Pamela checks the logs and matches the time and possible error that the customer saw.
This is a cumbersome process, and root cause analysis doesn't target the customer’s actual experience. Pamela needs a better way to do things.
Pamazon 2.0: Structured and persistent logs
Luckily for Pamela, application logging has evolved a lot with logging formats, structured logging (JSON) and better error messages. There are tools integrating code performance style measurements into running applications to measure near real-time performance of pieces of code at various layers (networking, disk, CPU) of the application stack. Pamela can capture, visualize and store these signals for a longer time. Big data processing frameworks let her aggregate and crunch data from different application landscapes (languages, architectures, device platforms) and deployment environments.
Pamazon 3.0: Tracing errors with logs
Pamazon is becoming a big success. It has a cloud/hybrid deployment environment, dealing with millions of global users over multiple device types. This means Pamela needs a more nuanced approach for:
- Generating valuable signals.
- Targeting likely root causes of issues.
Take the users Alice and Bob for example:
- Alice is in the USA using up her data connection to shop for fancy earrings on the Pamazon Android app.
- Bob is shopping for a black jacket from a Chilean research base on an Ubuntu PC.
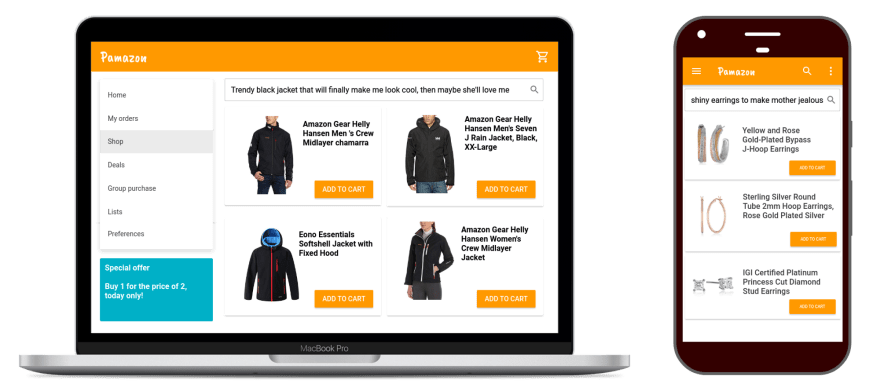
Will Alice and Bob have similar experiences? All answers point to no. Delivering localized search results to many different devices (not to mention different languages) worldwide is a complex and daunting endeavor. It requires precise ways to generate signals and target likely root causes of issues. More users and device types mean more and more ways for things to go wrong, and more root causes of issues.

In short, Pamela needs to up her game again.
What is OpenTelemetry?
OpenTelemetry is a project incubated by CNCF. It brings distributed tracing and metrics. Pamela has brought us on to implement this telemetry into her Jina Flow. Before getting started we have to learn a few new terms:
- Telemetry is on-site collection of measurements or other data at remote points and automatically sending them to receiving equipment for monitoring. Simply put, you can consider a log message or raw observation value of the error count during a request as a measurement.
- Instrumentation is the process of using instruments that record/collect raw observations that are transformed into signals and transmitted for monitoring purposes.
- Tracing involves a specialized use of logging to record information about a program's execution.
Bear these in mind, as Pamela has roped us into doing this.
How to use OpenTelemetry integration in Jina?
Jina >=3.12 comes with built-in OpenTelemetry integrations and features. Let's see how it works for Pamela. We now outline how to build a text-to-image search system using the following components:
- DocArray to manipulate data and interact with the storage backend using document store.
- Jina Flow to orchestrate microservices for data loading, encoding and storage.
- Jina Executor as the base to implement microservices.
- OpenTelemetry Collector Contrib to collect traces from the microservices.
- Sentry to visualise operations reported by the microservices.

💡In this post we’re just building out a backend, and not touching on a frontend. To build your own low-code backend+frontend neural search solution, check out Jina NOW.
Preparing the data
We derived the dataset by pre-processing the deepfashion dataset using Finetuner. The image label generated by Finetuner is extracted and formatted to produce the text attribute of each product.

Building a Flow with tracing enabled
💡You'll need Jina version ≥3.12.0 to use OpenTelemetry features.
We use a Jina Flow as a pipeline to connect our microservices (a.k.a Executors) together. Since we don't care too much about the nitty-gritty details, we won't dive into all the code, but just give a high-level overview. After all, the telemetry is the thing. Let's define the following in Python:
from jina import Flow, DocumentArray, Document

flow = (
    Flow(
        host='localhost',
        port=8080,
        tracing=True,
        traces_exporter_host='localhost',
        traces_exporter_port=4317,
    )
    .add(
        name='clip_encoder', # encode images/text into vectors
        host='localhost',
        port=51000,
        timeout_ready=3000000,
        uses_with={'name': 'ViT-B-32::openai'},
        external=True,
        tls=False,
    )
    .add(
        name='qdrant_indexer',
        uses='jinahub+docker://QdrantIndexer', # store vectors and metadata on disk
        uses_with={
            'collection_name': 'collection_name',
            'distance': 'cosine',
            'n_dim': 512,
        },
    )
)

with flow:
    flow.block()
💡This Flow uses pre-built Executors from Jina's Executor Hub, saving you time in writing code.

The Flow is composed of:
- The Gateway that manages request flows to the underlying microservices. The tracing arguments are provided to the Flow, enabling OpenTelemetry tracing features for each deployed microservice.
-
CLIP-as-service Executor that uses the default cpu torch runtime with the
ViT-L-14-336::openaimodel for encoding text and/or image data. Theclip_encoderservice is run using an independent Flow with the required tracing arguments. -
QdrantIndexer is the backend for storing and searching the dataset using Docarray. You'll need to provide the appropriate Qdrant
hostandportparameters if the database isn't running on localhost and the default port. The vector dimension is configured using theuses_withargument.
💡For more information on building a Flow read our docs.
Indexing and searching
Now that the components are in place, let's start adding data to our database, and then we can search for our favorite products using text. We can easily index our product images using the following code snippet:
from jina import DocumentArray, Client
da = DocumentArray.pull('deepfashion-text-preprocessed', show_progress=True)

# connect to the Flow
client = Client(host="grpc://0.0.0.0:8080")

# use only 100 Documents for demo
for docs in da[:100].batch(batch_size=10):
    client.post(on="/index", inputs=docs)
A sample search request looks like:
from jina import Client, DocumentArray, Document

client = Client(host='grpc://0.0.0.0:8080')
results = client.post('/search', DocumentArray(Document(text='jacket mens')))
💡For more information on Jina Client, check our docs.
Let’s break down the index and search processes described above:
-
clip_encodergenerates an embedding for thetextattribute of each product. TheFlow(...).add(...).add(...)definition creates a sequential topography by default. Requests to the Flow first pass through theclip_encoderservice and then results are passed to theqdrant_indexerservice. -
qdrant_indexerimplements the/indexendpoint for index operations and the/searchendpoint for search operations. The operations work on embeddings without any focus on other attributes of a product.
Enabling tracing on Executors
Now is a good time to learn a few OpenTelemetry terms:
- Tracing involves a specialized use of logging to record information about a program's execution.
- A trace represents a series or parallel or combinations of operations that were involved in producing the end result.
- Every trace is made up of one or more spans. Each span represents one operation in a trace, like
process_docs,sanitize_text, orembed_text.
The Hub Executors in the above example have instrumentation integrated by default. Let’s look at a simple example of providing the span with useful tags for the /index operation. The below code snippet from the QdrantIndexer creates two spans:
- Jina automatically creates the
/indexspan as part of the@requestsdecorator. This is one of Jina's automatic instrumentation features, providing value out of the box. - You can track more fine-grained operations such as the
qdrant_indexspan, which records the number of documents received in the request that must be indexed in Qdrant. Suspiciously quick indexing operations could be due to any empty request. On the flip side, very slow requests could be caused by too many large documents in the request. You can add more information to the span tags, such as the target Qdrant Collection and other deployment related information.
@requests(on='/index')
def index(self, docs: DocumentArray, tracing_context, **kwargs):
    """Index new documents
    :param docs: the Documents to index
    """
    with self.tracer.start_as_current_span(
        'qdrant_index', context=tracing_context
    ) as span:
        span.set_attribute('len_docs', len(docs))
        self._index.extend(docs)
Notice that the service.name attribute can be helpful if a single Qdrant cluster is used by different Flows to store different Documents.
Collecting and analyzing traces
Right now, Jina only supports the export mechanism to push telemetry signals to external systems. It uses OpenTelemetry Collector Contrib as the unified component to collect telemetry signals before exporting to enhanced components that transform the data for visualization and analysis. The collector setup is very basic and functions only as the uniform intermediary for collecting and exporting data.
We use the self-hosted Sentry application landscape to set up the actual APM or SPM. We'll only explore a small set of features supported by Sentry to preserve the focus of this post. Refer to the documentation for more details.
💡Application Performance Monitoring (APM) or the System Performance Monitoring (SPM) is the monitoring of performance and availability of applications. Service Level Indicators (SLI’s) detect and diagnose complex application performance problems to maintain an expected level of Service Level Objectives (SLO’s).
How to use Sentry to visualize and analyze the collected data?
Sentry has many features and custom definitions to translate telemetry signals into business terms. We'll just focus on the Performance, Transaction Summary and Trace, and Dashboard views, and using them to monitor the Flow and all Executors.
Performance view
The performance view gives the overall view of metric signals received by Sentry:

Summary view
You can click a span to view the transaction summary page. In our case, we clicked the /index span to bring up the index summary:

In the above screenshot:
- The TRACE ID column shows the span’s parent trace.
- The green section lists the spans that may be slow. By clicking the trace ID we can see the full trace of the operation.
- The red section helps diagnose and drill down to the root cause of abnormalities, errors or issues produced during this operation. The duration and status of the span is used to detect suspects and display tags that are part of the suspect spans. We can add useful tags to span attributes to detect suspect spans and tags more easily.
- The blue section shows the top tags in the selected time frame. This is a more general overview to gain quick insights into different attributes that you could use to drill down to the root cause of abnormalities.
Trace view
You can click a span’s event ID in the summary view to see its *********trace view*********. Let’s look at the trace view of a single /search operation:

In the figure above, the trace f1adb01bcb9fd18f59a5b38745f07e39 shows the end-to-end request flow with spans that were involved in generating the response. Span names are prefixed with rpc or default tags. These prefixes are determined by Sentry from the span tag attributes.
In this screenshot, Jina automatically creates the rpc spans which represent the internal requests flow. The rpc spans help to fill in the gaps and provide a complete view on top of the user added spans encode, inference, txt_minibatch_encoding, /search and qdrant_search.
Before drilling down into user-created spans, let’s look at the trace view in more depth. This is basically a directed acyclic graph connecting the dots from request beginning to end (left to right tracking of the bars). All these operations are sequential as seen by the top down rendering of the colored bars. Each operation's duration is displayed and is more useful if there are parallel operations or slow spans. To the left is the tree style (top down) representation of high level spans and spans nested under each operation. There are three top level spans because of the topology generated by the Flow.
- The client request reaches the Gateway, and the Gateway triggers a call to the
clip_encoderExecutor - The Executor creates an embedding of the search text and forwards it to the search endpoint of the
qdrant_indexer - The search endpoint retrieves products for the search query.
💡You can find more details and features such as displaying spans with errors in Sentry’s documentation.
A user can click any span for more information. We can click the clipencoder's' inference span to see more information. The inference span generates the embedding for the text attribute of Documents in the request:

- The
has_img_daandhas_txt_daspan attributes show if the document contained image and/or textual data. - The
minibatch_sizeshows the batch size used to generate embeddings using the configured thread pool.
Since the demo dataset of 100 Documents provides only text data, we see has_txt_da is set to True and the next span contains only the txt_minibatch_encoding span wherein text embeddings were actually generated using the thread pool.
Customize your Sentry dashboard
Lastly, let's see a sample performance monitoring dashboard for our example Flow. The various telemetry signals are combined to give a single outlook of the various indicators using which we can discern discrepancies or abnormal behaviors.

💡Refer to the documentation for more details on how to customize the dashboard and the error analysis graphs provided by Sentry.
Conclusion
By using OpenTelemetry, we've helped Pamela build a reliable product search system for her shopping site. This means that Pamela can now get reports and/or alerts for errors as they happen. Tracing issues becomes much easier. leading to a quicker response time and faster turnaround time for fixing issues.
She now has more time to focus on improving the website, increasing the assortment or adding new search features for her customers. This means happier customers all round, more business, and improved profits for Pamela.

If you’re interested in making your Jina applications more observable and reliable with OpenTelemetry (and replicating Pamela's success), read our docs.

Top comments (0)