This blog post shows you how to get started with Lighthouse CI, what are the different configurations and commands available to you and how to run your first scan and compare the results against a baseline that you specify.
Lighthouse CI is a node CLI that has a set of commands that make continuously running, asserting, saving, and retrieving Lighthouse results as easy as possible. Lighthouse CI is made up of 2 components, the node CLI to run the different commands and the node server where results are uploaded and stored for you to compare the scores and see trends of individual metrics.
Getting Started
The easiest way to get started with Lighthouse CI is by installing the node CLI globally on your computer. To do this, run npm install -g @lhci/cli. Once the CLI is installed successfully, you can invoke it and understand the options available to you by running lhci --help. You should now see 6 commands available to you.
Configuration
Each of the individual commands have accept some arguments. Run the help command lhci <commandname>--help to understand what configuration options are available to you. Lighthouse CI uses the YARGS API to read configuration and that means you can pass arguments to the CLI in multiple ways and are read in the below order of precedence.
- CLI arguments
- Environment Variables
- Configuration Files
- Default Settings
The GitHub documentation goes into great detail with examples of the different configuration options. Throughout this post, I will be using a configuration file to pass arguments. The JSON file structure has the below format and is called lighthouserc.json and is at the root of the current working directory.
The final configuration file is available in this repository on GitHub.
{
  "ci": {
    "collect": {
      // collect options here
    },
    "assert": {
      // assert options here
    },
    "upload": {
      // upload options here
    },
    "server": {
      // server options here
    }
  }
}
Next, let us take a look at the different commands available to us and what they accomplish and how to specify the proper configuration under the relevant sections of the configuration file.
HealthCheck Command
The first command is the health check. The healthcheck command performs a set of checks to ensure a valid configuration and very useful when setting up Lighthouse CI initially.
Run lhci healthcheck on the command prompt and then depending on the contents of your configuration file, you will see different types of checks being executed. Here is the result of a successful health check.
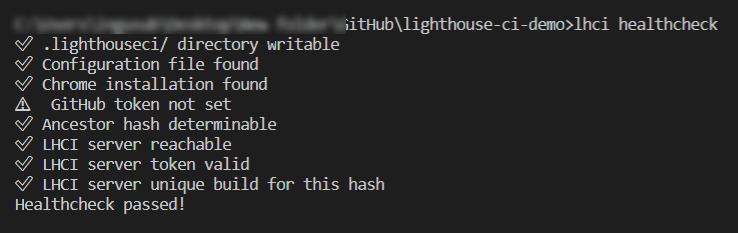
You should execute the healthcheck multiple times as you build up your configuration to understand what checks are included and how the results differ.
Collect Command
Next and perhaps the most important command is the collect command runs Lighthouse scan the specified number of times on and “collects” the results in a .lighthouseci/ folder relative to the current working directory. Run lhci collect --help to see the different configuration options available and how it maps to the JSON file below.
The collect command allows you to
- Run scans on multiple URL’s and also scan each URL multiple times.
- Run a puppeteer script so that you can log in to the website and then scan pages that require authentication. Note that you will need to install the puppeteer package from NPM.
{
  "collect": {
    "method": "node",
    "additive": false, // Clean up previous lighthouse runs
    "headful": false, // Headless Chrome
    "numberOfRuns": 3, // 3 runs per each URL
    "puppeteerScript": "./fake-login.js", // Run this script before auditing below URLs'. Usually Login Scripts.
    "url": [
      "https://www.gurucharan.in/",
      "https://www.gurucharan.in/about/"
    ],
    "settings": {
      "config-path": "./light-house-config.js" // Flags to pass to lightHouse
    }
  }
}
With the configuration in place, you can now run lhci collect and if everything is successful, you will see the Lighthouse results inside the .lighthouseci/ folder.
Assert Command
We have successfully run our Lighthouse scans and “collected” our results. The next logical step is to run a bunch of tests that verify that the results meet expectations. As with the other commands, below is a snippet of the configuration file.
{
  "assert": {
    "preset": "lighthouse:no-pwa",
    "assertions": {
      "categories:performance": ["warn", {"aggregationMethod": "optimistic", "minScore": 0.70}],
      "categories:accessibility": ["warn", {"aggregationMethod": "optimistic", "minScore": 0.90}]
  }
}
One thing that needs mentioning is that the assertion operation supports a wide range of configurations. You can test against built-in presets or assert against individual categories of Lighthouse results and even set baselines on every metric in the scan results.
When checking the results of runs against multiple URLs, different assertions can be made for different URL patterns using regular expressions. Definitely take a look at the documentation for the assert operation where other options are documented.
In this example, we run tests against the built-in preset which ignores PWA (Progressive Web App) evaluation. We also assert against said performance and accessibility against a baseline score of 0.70 for performance and 0.90 for accessibility. Since we ran the scan against each URL thrice, we specify optimistic as aggregation method which instructs Lighthouse to take the score that has the highest chance of success.
This post showed the basics of getting started with Lighthouse CI and how to run your first scan and compare results against a baseline. In part 2, we continue to look at how to set up a Lighthouse server so that we can upload the scan results, see trends and compare the scores of your site at different points in time.

Top comments (0)