*Memos:
- My post explains RandomAffine().
- My post explains RandomPerspective().
- My post explains RandomHorizontalFlip().
- My post explains RandomVerticalFlip().
- My post explains OxfordIIITPet().
RandomRotation() can rotate an image randomly as shown below:
*Memos:
- The 1st argument for initialization is
degrees(Required-Type:int,floatortuple/list(intorfloat)): *Memos:- It can do rotation.
- It's the range of the degrees
[min, max]so it must bemin <= max. - A tuple/list must be the 1D with 2 elements.
- A single value must be
0 <= x. - A single value means
[-degrees, +degrees].
- The 2nd argument for initialization is
interpolation(Optional-Default:InterpolationMode.NEAREST-Type:InterpolationMode). - The 3rd argument for initialization is
expand(Optional-Default:False-Type:bool). - The 4th argument for initialization is
center(Optional-Default:None-Type:tuple/list(intorfloat)): *Memos:- It can change the center position of an image.
- It must be the 1D with 2 elements.
- The 5th argument for initialization is
fill(Optional-Default:0-Type:int,floatortuple/list(intorfloat)): *Memos:- It can change the background of an image. *The background can be seen when rotating an image.
- A tuple/list must be the 1D with 1 or 3 elements.
- The 1st argument is
img(Required-Type:PIL Imageortensor(int)): *Memos:- A tensor must be 3D.
- Don't use
img=.
-
v2is recommended to use according to V1 or V2? Which one should I use?.
from torchvision.datasets import OxfordIIITPet
from torchvision.transforms.v2 import RandomRotation
from torchvision.transforms.functional import InterpolationMode
randomrotation = RandomRotation(degrees=90)
randomrotation = RandomRotation(degrees=[-90, 90],
interpolation=InterpolationMode.NEAREST,
expand=False,
center=None,
fill=0)
randomrotation
# RandomRotation(degrees=[-90.0, 90.0],
# interpolation=InterpolationMode.NEAREST,
# expand=False,
# fill=0)
randomrotation.degrees
# [-90.0, 90.0]
randomrotation.interpolation
# <InterpolationMode.NEAREST: 'nearest'>
randomrotation.expand
# False
print(randomrotation.center)
# None
randomrotation.fill
# 0
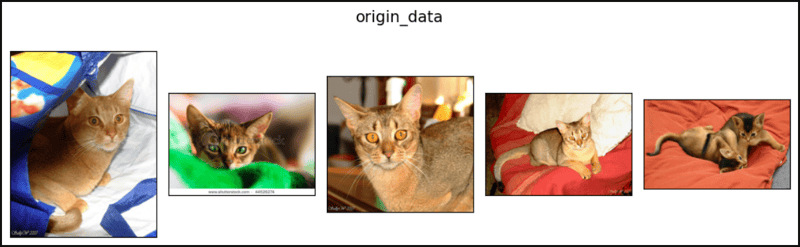
origin_data = OxfordIIITPet(
root="data",
transform=None
# transform=RandomRotation(degrees=[0, 0])
)
d90_data = OxfordIIITPet( # `d` is degrees.
root="data",
transform=RandomRotation(degrees=90)
# transform=RandomRotation(degrees=[-90, 90])
)
d90_90_data = OxfordIIITPet(
root="data",
transform=RandomRotation(degrees=[90, 90])
)
dn90n90expand_data = OxfordIIITPet( # `n` is negative.
root="data",
transform=RandomRotation(degrees=[-90, -90], expand=True)
)
d180_180c270_200_data = OxfordIIITPet( # `c` is center.
root="data",
transform=RandomRotation(degrees=[180, 180], center=[270, 200])
)
dn45n45fgray_data = OxfordIIITPet( # `f` is fill.
root="data",
transform=RandomRotation(degrees=[-45, -45], fill=150)
)
d135_135fpurple_data = OxfordIIITPet(
root="data",
transform=RandomRotation(degrees=[135, 135], fill=[160, 32, 240])
)
import matplotlib.pyplot as plt
def show_images1(data, main_title=None):
plt.figure(figsize=[10, 5])
plt.suptitle(t=main_title, y=0.8, fontsize=14)
for i, (im, _) in zip(range(1, 6), data):
plt.subplot(1, 5, i)
plt.imshow(X=im)
plt.xticks(ticks=[])
plt.yticks(ticks=[])
plt.tight_layout()
plt.show()
show_images1(data=origin_data, main_title="origin_data")
show_images1(data=d90_data , main_title="d90_data ")
show_images1(data=d90_90_data, main_title="d90_90_data")
show_images1(data=dn90n90expand_data, main_title="dn90n90expand_data")
show_images1(data=d180_180c270_200_data, main_title="d180_180c270_200_data")
show_images1(data=dn45n45fgray_data, main_title="dn45n45fgray_data")
show_images1(data=d135_135fpurple_data, main_title="d135_135fpurple_data")
# ↓ ↓ ↓ ↓ ↓ ↓ The code below is identical to the code above. ↓ ↓ ↓ ↓ ↓ ↓
def show_images2(data, main_title=None, d=0, e=False, c=None, f=0):
plt.figure(figsize=[10, 5])
plt.suptitle(t=main_title, y=0.8, fontsize=14)
for i, (im, _) in zip(range(1, 6), data):
plt.subplot(1, 5, i)
rr = RandomRotation(degrees=d, expand=e, center=c, fill=f) # Here
plt.imshow(X=rr(im)) # Here
plt.xticks(ticks=[])
plt.yticks(ticks=[])
plt.tight_layout()
plt.show()
show_images2(data=origin_data, main_title="origin_data")
show_images2(data=origin_data, main_title="d90_data", d=90)
show_images2(data=origin_data, main_title="d90_90_data", d=[90, 90])
show_images2(data=origin_data, main_title="dn90n90expand_data", d=[-90, -90],
e=True)
show_images2(data=origin_data, main_title="d180_180c270_200_data",
d=[180, 180], c=[270, 200])
show_images2(data=origin_data, main_title="dn45n45fgray_data",
d=[-45, -45], f=150)
show_images2(data=origin_data, main_title="d135_135fpurple_data",
d=[135, 135], f=[160, 32, 240])


Top comments (0)