Introduction
This blog demonstrates how to generate, ingest, store and vizualize IoT device metrics by using the Embedded Metric Format (EMF) and native integrations between AWS IoT Core Rules Engine and Amazon CloudWatch, as well as CloudWatch Logs and Metrics. The Amazon CloudWatch Embedded Metric Format is a JSON specification used to instruct Amazon CloudWatch Logs to automatically extract metric values embedded in structured log events.
In this post, we will see how to:
- Ingest metric values embedded in structured log events in batch mode via the AWS IoT Core Rules Engine and the Basic Ingest feature.
- Store these log events in Amazon CloudWatch.
- View the metrics in Amazon CloudWatch Metrics and create graphs on the extracted metric values.
For a detailed walk-through a live demo of this solution, you can watch the video linked below on the IoT Builders YouTube channel:
Batch Ingestion of IoT Device Metrics into Amazon CloudWatch Metrics
Benefits of this Approach
The benefit of using Basic Ingest is optimizing the data flow by removing the AWS IoT Core MQTT Broker from the ingestion path, thus removing the messaging costs.
On the device-side, sending metrics in batches is more efficient and caters for temporary connectivity loss. The EMF timestamps ensure that metrics are stored in an eventually consistent manner. The integration between AWS IoT Rules Engine and Amazon CloudWatch happens via a Rules Action, therefore reducing the need for bespoke code. Another benefit of this approach is that Amazon CloudWatch automatically extracts the metrics from logs.
Overview
In this post, we will walk through the steps to generate IoT device metrics in the EMF format, like system or OS information at a sampling interval, batch them and ingest them using Basic Ingest, at a chosen reporting interval. This means that metrics are consolidated and sent in batches (independently of the collection time), instead of being routed event by event (one-by-one as they occur).
Once the batched metrics arrive at the IoT Rule, they are routed to Amazon CloudWatch using batchMode. batchMode is a Boolean parameter within the AWS IoT CloudWatch Logs rule action. This parameter is optional and is off (false) by default. To upload device-side log files in batches, you must turn this parameter on (true) when you create the AWS IoT rule.
Because the logs follow the EMF specification, Amazon CloudWatch automatically extracts the metric values embedded in structured log events, and we can create graphs and alarms on the extracted metric values.
The diagram below shows the ingestion flow:

Set-up
To run this demo, clone the repo: https://github.com/aws-iot-builder-tools/emf-metrics-with-iot-rules
This repository is composed of two folders:
-
app- containing the application code and configuration. -
infra- containing the infrastructure CDK code and configuration.
You will need both to set up the demo.
To run the demo, the following steps should be performed:
1. Deploy the required AWS resources:
The AWS resources for this demo are created and deployed using AWS CDK. The CDK Typescript code creates and deploys:
- An IoT device policy, allowing the device to connect to AWS IoT Core and publish data on the Basic Ingest Rule topic. This policy looks as below:
{
  "Version": "2012-10-17",
  "Statement": [
    {
      "Action": [
        "iot:Connect"
      ],
      "Resource": [
        "arn:aws:iot:<AWS_REGION>:<AWS_ACCOUNT>:client/${iot:ClientId}"
      ],
      "Effect": "Allow"
    },
    {
      "Action": [
        "iot:Publish"
      ],
      "Resource": [
        "arn:aws:iot:<AWS_REGION>:<AWS_ACCOUNT>:topic/$aws/rules/emf/${iot:ClientId}/logs"
      ],
      "Effect": "Allow"
    }
  ]
}
- An IoT Rule for Basic Ingest, configured with an action to batch ingest log entries into Amazon CloudWatch.
- An IAM Role with the correct IAM policy allowing the IoT Rule to ingest into CloudWatch.
Pre-requisites:
- You must have AWS CDK installed and configured with the required credentials for your AWS Account. For help with this, follow the steps in the documentation.
Steps:
- In the
infradirectory , runnpm run build. - Run
cdk deploy.
2. Run the IoT Device Simulation Application:
The IoT application connects to AWS IoT Core using an MQTT client implemented with MQTT.Js, reads operating system metrics on a sampling interval of 5 seconds, stores them in an in-memory array and ingests them in batches at a reporting interval of 15 seconds. In the app folder, there is also a utility function which, in an idempotent manner, creates the IoT thing, certificate and keys.
Pre-requisites:
To run the IoT application, you need to ensure:
- That your application has the correct credentials to make calls to AWS IoT to create the IoT thing, certificate and keys (More info here.
- That the correct
AWS Regionis also configured.
Steps:
- Fill in
config.jswith your IoT endpoint configuration:
export const config = {
    iotEndpoint: "<YOUR_AWS_IOT_ENDPOINT>",
    region: "<YOUR_AWS_REGION>"
}
- Run
npm installin theappdirectory. - Run
node app.js
Metrics Format and Ingestion
On the device, metric values are embedded in structured log events, so that Amazon CloudWatch can automatically extract them. In the example, memory metrics and network metrics are stored in 2 different namespaces iot-device-memory and iot-device-network. The format looks as follows:
const statObject = {
    "_aws": {
        "Timestamp": Date.now(),
        "CloudWatchMetrics": [
            {
                "Namespace": "iot-device-memory",
                "Dimensions": [["thingName"]],
                "Metrics": [
                    {
                        "Name": "total",
                        "Unit": "Kb",
                        "StorageResolution": 1
                    },
                    {
                        "Name": "free",
                        "Unit": "Kb",
                        "StorageResolution": 1
                    },
                    {
                        "Name": "used",
                        "Unit": "Kb",
                        "StorageResolution": 1
                    },
                    {
                        "Name": "active",
                        "Unit": "Kb",
                        "StorageResolution": 60
                    }, {
                        "Name": "available",
                        "Unit": "Kb",
                        "StorageResolution": 1
                    },
                ]
            },
            {
                "Namespace": "iot-device-network",
                "Dimensions": [["thingName"]],
                "Metrics": [
                    {
                        "Name": "operstate",
                         "Unit": "String",
                        "StorageResolution": 1
                    },
                    {
                        "Name": "rx_bytes",
                        "Unit": "Kb",
                        "StorageResolution": 1
                    },
                    {
                        "Name": "rx_dropped",
                        "Unit": "Kb",
                        "StorageResolution": 1
                    },
                    {
                        "Name": "rx_errors",
                        "Unit": "Count",
                        "StorageResolution": 1
                    },
                    {
                        "Name": "tx_bytes",
                        "Unit": "Kb",
                        "StorageResolution": 1
                    }, {
                        "Name": "tx_dropped",
                        "Unit": "Kb",
                        "StorageResolution": 1
                    },
                    {
                        "Name": "tx_errors",
                        "Unit": "Count",
                        "StorageResolution": 1
                    }, {
                        "Name": "ms",
                        "Unit": "Milliseconds",
                        "StorageResolution": 1
                    },
                ]
            }
        ]
    },
    "thingName": CLIENT_ID,
    "total": convertSize(memory.total, "KB"),
    "free": convertSize(memory.free,"KB"),
    "used": convertSize(memory.used,"KB"),
    "active": convertSize(memory.active,"KB"),
    "available": convertSize(memory.available,"KB"),
    "iface": iface,
    "operstate": network_0.operstate,
    "rx_bytes": convertSize(network_0.rx_bytes,"KB"),
    "rx_dropped": convertSize(network_0.rx_dropped,"KB"),
    "rx_errors": network_0.rx_errors,
    "tx_bytes": convertSize(network_0.tx_bytes,"KB"),
    "tx_dropped": convertSize(network_0.tx_dropped,"KB"),
    "tx_errors": network_0.tx_errors,
    "ms": network_0.ms,
    "requestId": v4()
}
The "convert-size" JavaScript library is used to convert from bytes to kilobytes. Every 5 seconds (as configured via the sampling interval), a new entry is collected in the statsObject, and added to an in-memory array. Every 15 seconds (as configured by the reporting interval), a batch object is constructed containing the array, and this object is published into the Basic Ingest IoT Rule Topic, as below:
let message = {
                batch: []
            }
            metrics.forEach(metric => {
                message.batch.push(
                    {"timestamp": Date.now(), "message": JSON.stringify(metric)});
            })
client.publish(METRICS_PUB_TOPIC, JSON.stringify(message), {
                qos: 1,
                properties: {
                    contentType: 'application/json',
                    correlationData: JSON.stringify({messageId: messageId, appId: appId})
                }
            });
On the AWS cloud-side, an IoT Rule is created as per CDK code below:
new CfnTopicRule(this, 'BasicIngestEMFIoTRule', {
            ruleName: 'emf',
            topicRulePayload: {
                actions: [
                    {
                        cloudwatchLogs: {
                            logGroupName: LOG_GROUP_NAME,
                            roleArn: CWRole.roleArn,
                            batchMode: true,
                        }
                    }
                ],
                description: 'IoT Rule',
                sql: `SELECT VALUE *.batch
                      FROM '${METRICS_RULE_TOPIC}'`,
                ruleDisabled: false,
                awsIotSqlVersion: '2016-03-23'
            }
        });
The video below shows the application log for storing and publishing the metrics in batches:
Amazon CloudWatch Logs and CloudWatch Metrics
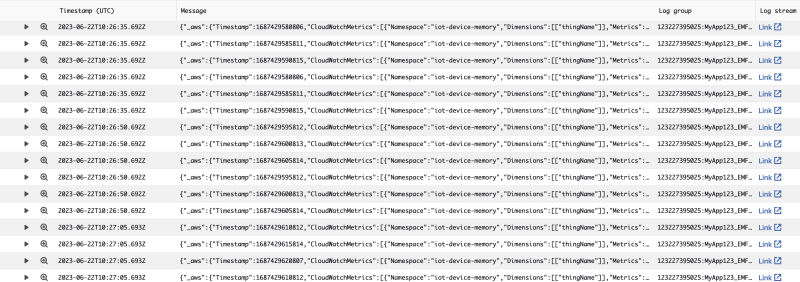
Upon batch ingestion, each item in the batch will be stored as a separate entry in CloudWatch logs. Because the format used is EMF, the metrics are extracted by Amazon CloudWatch and available in CloudWatch Metrics to create charts and alarms. Below is a video of how the log entries look with the LiveTail view:

Each element in the batch sent from the IoT device is stored as a separate log entry, with the correct reporting timestamped passed from the device. The sampling timestamps for the metrics become relevant when the metrics are extracted. Below is a log entry view from the LiveTail:
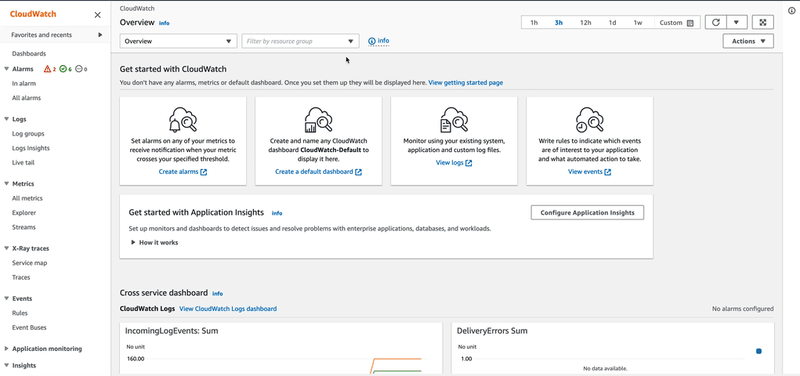
Navigating to Amazon CloudWatch Metrics, you can see the two newly created namespaces with thing name as the dimension. By clicking one of the namespaces, you can plot the metrics values over time, with the desired aggregations, as shown in the video below:
Conclusion
In this post, we looked at how to leverage Basic Ingest and the AWS IoT CloudWatch Logs Action in Batch Mode, in order to ingest and route device metrics in EMF format. The benefit of this approach is that Amazon CloudWatch automatically extracts the metrics from logs. Additionally, ingestion costs are reduced by using Basic Ingest. In case of temporary loss of connectivity, the batching functionality will ensure eventual data consistency.
Once the metrics are in the cloud, they can be viewed in CloudWatch metrics, to prepare charts or set alarms. For more information on uploading IoT device logs to Amazon CloudWatch, have a look at the developer documentation. To learn more about EMF, check the specification.
To get notified about more IoT content, you can additionally subscribe to the IoT Builders YouTube channel.


Top comments (0)