
In an ever-growing software world, many times we as a developer feel it would be better if we can monitor the performance cost of our development, live. It is really helpful to figure out the performance issue early as it can save both time and cost to the organizations. MiniProfiler helps us in solving the performance problem and gives the developer more control over testing and finding the root cause after deploying code in the Test and Production environment.
As per mini-profiler website:
- MiniProfiler is a library and UI for profiling your application. By letting you see where your time is spent, which queries are run, and any other custom timings you want to add, MiniProfiler helps you debug issues and optimize performance.
- The default setup is for every page to have an indicator so performance is always on your mind, like this:
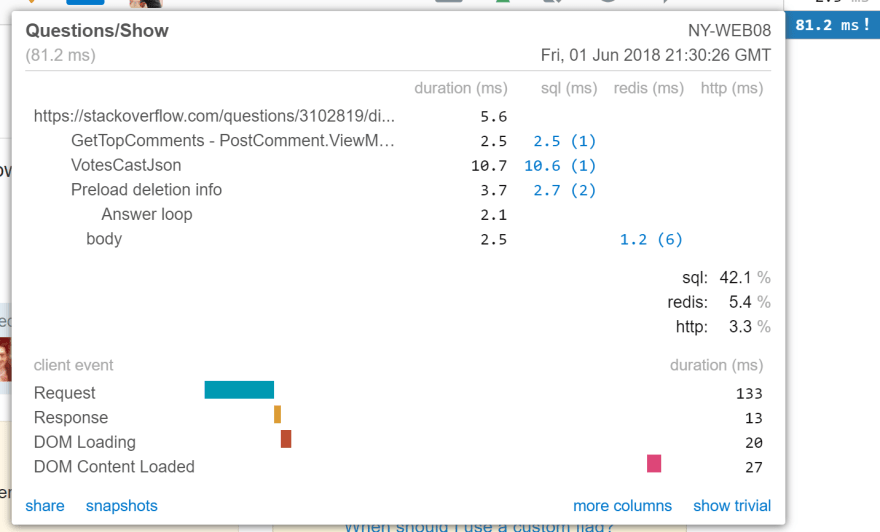
Any custom timings (like queries) can be expanded in detail as well:
Now lets see the above in action. We will use a sample app build using Asp .Net core MVC along with SQL server local DB.
-
About our app:
- Our app contains a web api call on page load
- On submit we will insert data into the database(I am using a SQL local DB. I have shared the script in git repo)
- Once the project is set let us start with miniprofiler configuration
Install nuget miniprofiler.aspnetcore.mvc on your web project

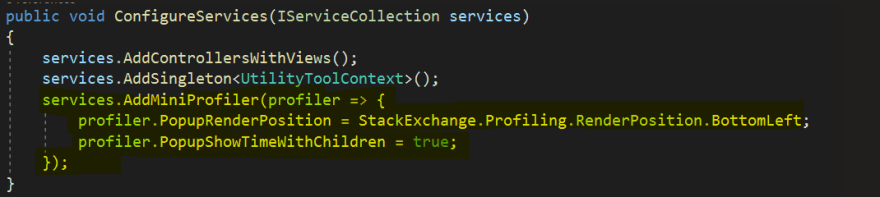
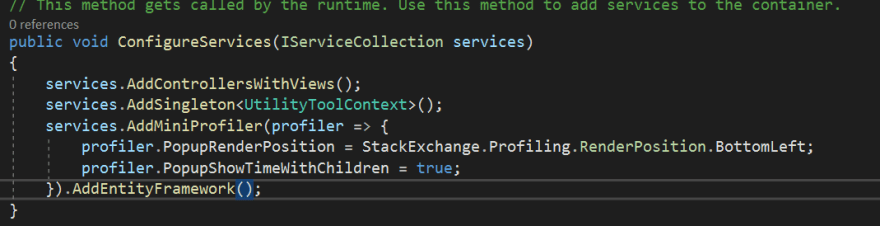
- Add below highlighted lines in ConfigureServices():
There are many other configurations which can be used as per project requirement, but I am going with minimal configuration.
- Add below highlighted lines in Configure()

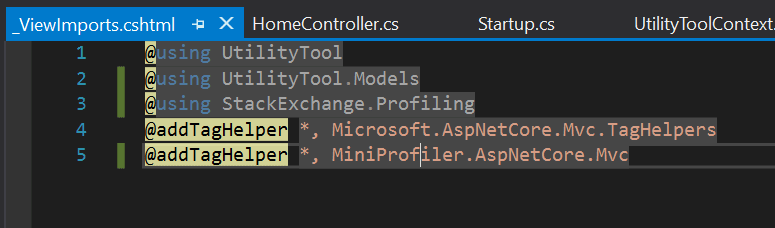
- Modify _ViewImport view with below code:
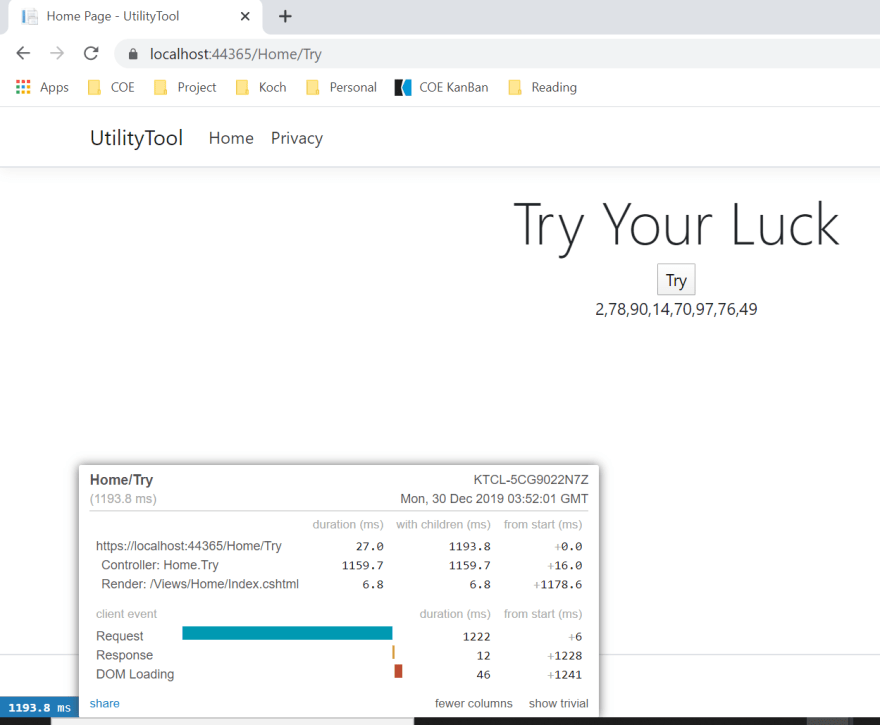
- Now we are good to test our web app. As you can see below our popup is displayed on the bottom left as we have configured in ConfigureServices()
On load, we are making an API call and we can see the details of how much time the API is taking.
Note: Please use a pipeline to better control the HTTP calls as it is not possible to configure miniprofiler for each call.
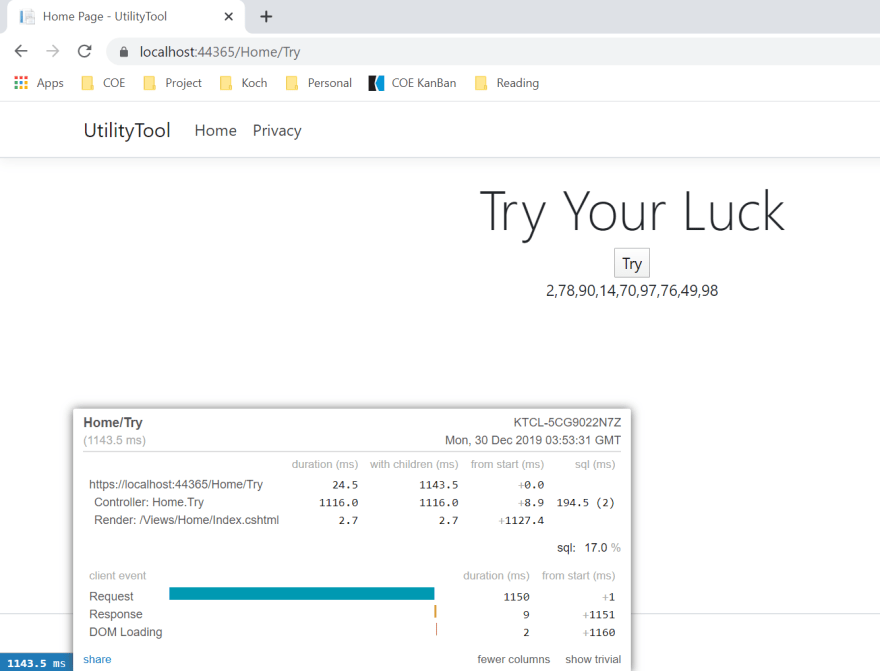
Also when we click on the Try button on the home page we are making a DB call
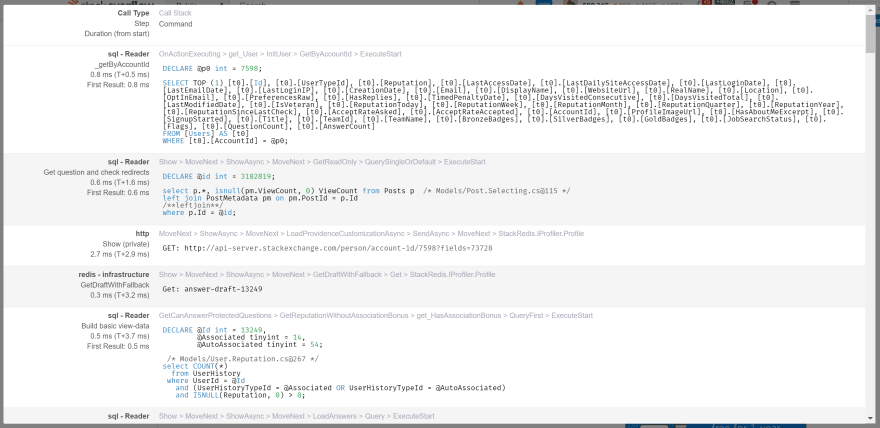
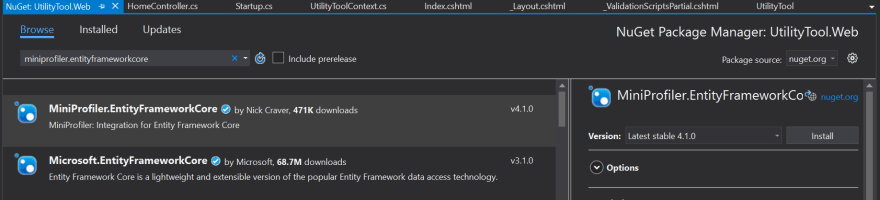
In case we need more details of our SQL calls, add miniprofiler.entityframeworkcore nuget package to your Web project:
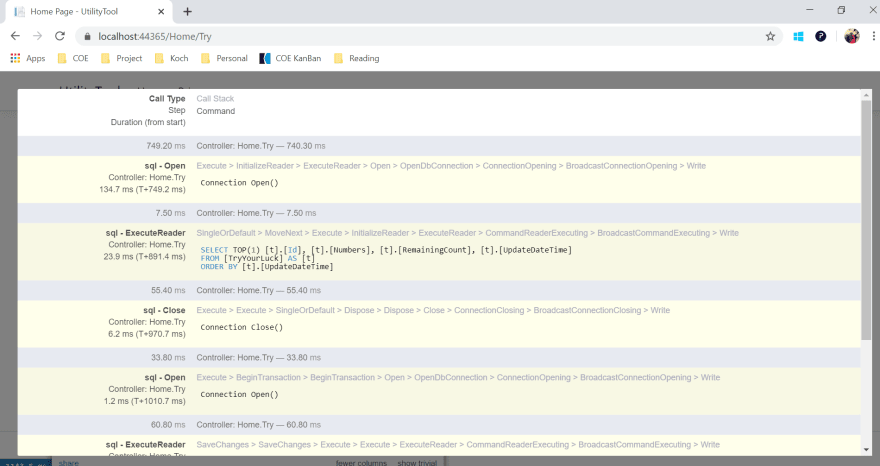
Now if we reload the application we can see in detail what DB calls are happening by clicking on SQL time taken.
In case if you are using ADO .Net and not using EnityFramework, it is easy to modify the data access layer and use ProfiledDbConnection to return the DbConnection object. Please refer to code snippet.
public DbConnection GetConnection()
{
    DbConnection connection = new System.Data.SqlClient.SqlConnection("...");
    return new StackExchange.Profiling.Data.ProfiledDbConnection(connection, MiniProfiler.Current);
}
Generally, we tend to have a large functionality that is broken into multiple methods, we can still use miniprofiler to figure out which particular method is causing trouble.
Nuget required: miniprofiler.aspnetcore
using (StackExchange.Profiling.MiniProfiler.Current.Step("Method1 begins"))
{
    //Method1()
}

using (StackExchange.Profiling.MiniProfiler.Current.Step("Method2 begins"))
{
    //Method2()
}

using (StackExchange.Profiling.MiniProfiler.Current.Step("Method3 begins"))
{
    //Method3()
}
How to secure the information?
Now as we know,

We need to display this information only to our DEV teams. Now we can control the access using Roles information present in HttpContext as shown below.
public void ConfigureServices(IServiceCollection services)
        {
            services.AddControllersWithViews();
            services.AddSingleton<UtilityToolContext>();
            services.AddMiniProfiler(profiler => {
                profiler.PopupRenderPosition = StackExchange.Profiling.RenderPosition.BottomLeft;
                profiler.PopupShowTimeWithChildren = true;
                profiler.ResultsAuthorize = (request) => request.HttpContext.User.IsInRole("DEV");
            }).AddEntityFramework();
        }
Is it fast to be used in large applications?

In case if you are worried about its performance in production, please note that MiniProfiler was designed by the team at Stack Overflow. It is in production use there and on the Stack Exchange family of sites.
Git Repo: https://github.com/jai00271/MiniProfiler
References:

Top comments (0)