
In October 2019, my friends and I are planning our awesome holiday in Greece and Amalfi. The way we plan our perfect holiday itinerary is by using Google Map. We search for the places to visit and pin markers on Google Map for attractions that might interest us.
For me, to optimise our vacation to the fullest, as to cover as much ground as possible; I have three questions:
- How many days should I spend at one location?
- Which attractions/locations should I visit each day?
- What is the most optimal route from a place to another?
Let me show you the itinerary my algorithms have proposed for us. It is recommending the best sequence of places to visit, day by day.

- Start from Athens, visit the Acropolis and other historic archaeological sites. That’s a great start!
- Travel to Santorini, a beautiful island with whitewashed homes and picture-perfect sunsets.
- Sail to Crete, for a road trip adventure of a lifetime, by exploring hidden corners and tasting the best of Greek cuisine.
- Fly to Italy and travel to Amalfi and Ravello where the terraces are blending along the cliffs with the most spectacular coastal scenery.
- Travel to Sorrento and Naples, indulge in the best pasta, pizza, limoncello, and gelato.
Great holiday itinerary isn’t it?! This sequence of locations is fully generated by the algorithm. Would you like to try this for your next holiday? I have the codes ready for you.
In this article, I am going to show you exactly how you can do it too for your next vacation!
![View of Atrani, while hiking to Ravello [photo by Hong Jing (Jingles)]](https://res.cloudinary.com/practicaldev/image/fetch/s--gd29C4cl--/c_limit%2Cf_auto%2Cfl_progressive%2Cq_auto%2Cw_880/https://jinglescode.github.io/assets/img/posts/improve-holiday-itinerary-with-machine-learning-03.webp)
Preparation
Pin locations on Google Maps. Visit My Maps and create a new map for your next holiday destination. Look for places you want to visit. Attractions? Theme parks? Restaurants? Fill up your map with markers by searching for these places and “Add to map”. Keep doing this until you have all the places you want to visit on the map. I will wait for you.


Export map and upload into Colab. After all the hard work of researching and pinning places to visit, we are ready to export the map. Select “Export to KML/KMZ”, and remember to check “Export as KML”. You will download a KML file.


Export KML file from Google Maps and upload it in Colab
Next, go to Colab, an excellent Notebook environment maintained by Google. Open the File drawer on the left and upload the KML file which you have downloaded. We will be loading this KML file with BeautifulSoup later.
Get the Google API key. We will be plotting markers on Google Maps, so we need an API key. You can get it from the developers API page. Follow the instructions and you should get a key that looks like this:
ZIzkSyDwhp5B0_tH1$Is@fAkeAp1keY3eLYmPLY
Psst: this is a fake API key 🙃
]](https://res.cloudinary.com/practicaldev/image/fetch/s--E-FDkH7A--/c_limit%2Cf_auto%2Cfl_progressive%2Cq_auto%2Cw_880/https://jinglescode.github.io/assets/img/posts/improve-holiday-itinerary-with-machine-learning-09.webp)
Code walkthrough on Colab
You can get the codes and run it on Colab.
Define the parameters. Let’s set the API key, KML filename, and the desired number of days for your long-awaited holiday.
The API key is for plotting interactive Google Maps on Colab. The KML file contains the places of interests you have pinned on Google Maps. And lastly, the algorithm will determine where you should visit for each day based on the number of days you have set.

Load the data. KML files are XML, and we can parse it with BeautifulSoup. Our places of interests are inside the “Placemark” tag, so we will extract the “name”, and “coordinates” from each “Placemark”.
Let’s see if the DataFrame contains places we are planning to visit.
Group locations by proximity. With the coordinates for each location in the DataFrame, we can group them into clusters. If two places are near each other, they will be in the same cluster. There are a few methods for clustering, I will introduce K-Means, spectral and mean-shift clustering.
K-Means clustering aims to partition data points into a specified number of clusters. In which each data point belongs to the cluster that it is nearest to.
Spectral clustering is useful when the structure of the individual clusters is highly non-convex. It performs dimensionality reduction before clustering in fewer dimensions.
Mean shift clustering is a centroid-based algorithm which aims to discover blobs in a smooth density of data points. It works by updating candidates for centroids to be the mean of the points within a region.
Which one did I end up using? K-Means. Because it is straight forward, and the most common one.
Plot it on Google Maps! Now, we are ready to plot it on Google Maps to visualise the 12 main areas (because we are planning a holiday for 12 days). If you are running this on Colab, this map is interactive.

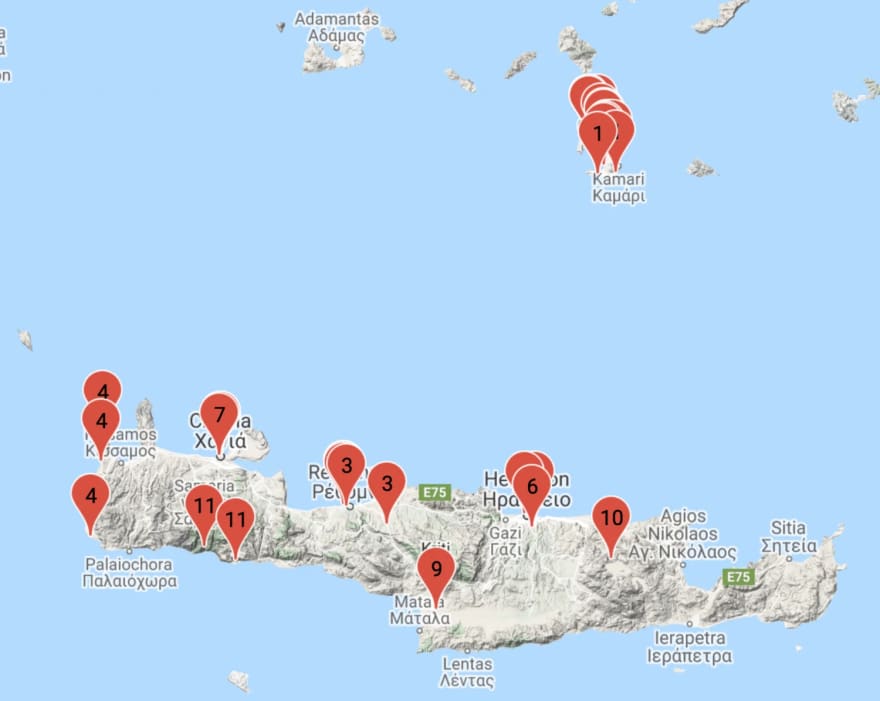

Athens. Santorini and Crete. Amalfi and Naples.
The clustering algorithm did a great job grouping locations by proximity. Next, I am interested in finding out the most optimal route from a region to another region.
Find the middle of each cluster. We need to find the middle point of each cluster. We do this with Pandas groupby function: places.groupby(‘cluster’).mean(). That will give us a DataFrame, where each row represents a cluster of locations, and it’s latitude and longitude.
Find the distance between cluster. We need to find the distance between each cluster. We use the middle point of each cluster and calculate the distance between clusters with Scipy cdist function.
That will give us a DataFrame, with the distance of each cluster to every other cluster. We will call this matrix the distance matrix. Each value represents the distance between two clusters. A smaller value means the cluster is closer to each other.
Find the shortest route. With that distance matrix, we are ready to find the shortest path. Here is the code to compute the shortest path.
Initially, I was using the travelling salesman algorithm, but I find that the code’s a little overkill and overcomplicated, so I wrote my own instead. This is the result based on the shortest path algorithm, a sequence from cluster to cluster.
2 -> 1 -> 6 -> 10 -> 9 -> 3 -> 11 -> 7 -> 4 -> 5 -> 8 -> 0
Show the recommended itinerary. Now we are ready to plot our markers on Google Map. It has recommended us to go from Athens, Santorini, and Crete. Then to Amalfi, Ravello, Sorrento and Naples. If you are running this on Colab, this map is interactive.


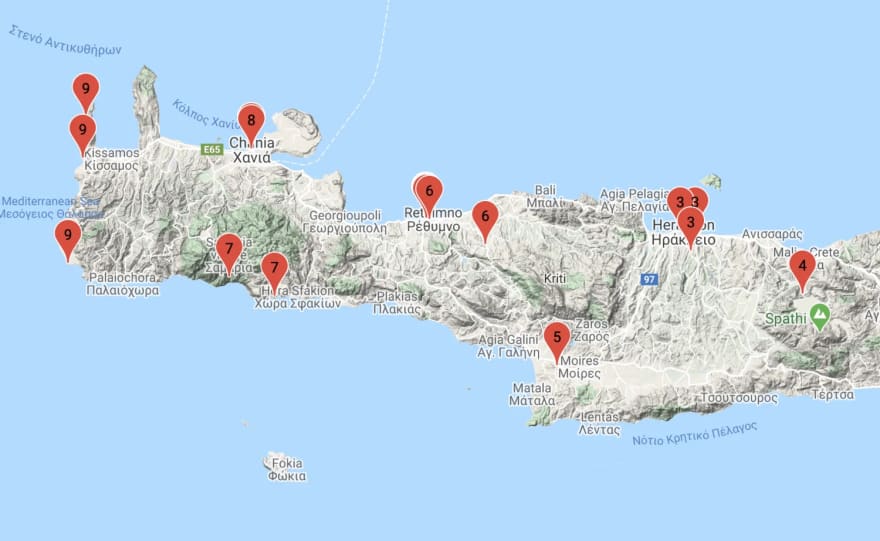


Start with Athens, Santorini, and then Crete. To Amalfi, Ravello, Sorrento and Naples.
If you prefer to see it in tabular form, we can display it with Pandas.
pd.set_option(‘display.max_rows’, None)
places.sort_values(by=[‘days’])
]](https://res.cloudinary.com/practicaldev/image/fetch/s---1AhS6oL--/c_limit%2Cf_auto%2Cfl_progressive%2Cq_auto%2Cw_880/https://jinglescode.github.io/assets/img/posts/improve-holiday-itinerary-with-machine-learning-19.webp)
What can be improved?
This algorithm does not take the number of attractions in one region into consideration. For instance, we absolutely didn’t want to explore everything in Athens in one day! Neither is just one day at Santorini enough.
We need a type of clustering algorithm that constraint on the maximum number of points in a cluster. Such that, every cluster should have about the same number of locations. If a cluster is becoming too dense, it will split the cluster into two or more clusters.
But if you are travelling in one city, the result can be promising. This is the generated itinerary for New York City. Feel free to download my itinerary and try it for yourself.
](https://res.cloudinary.com/practicaldev/image/fetch/s--6SD4K0kF--/c_limit%2Cf_auto%2Cfl_progressive%2Cq_auto%2Cw_880/https://jinglescode.github.io/assets/img/posts/improve-holiday-itinerary-with-machine-learning-20.webp%23float_left)
]](https://res.cloudinary.com/practicaldev/image/fetch/s--WBFqXzZA--/c_limit%2Cf_auto%2Cfl_progressive%2Cq_auto%2Cw_880/https://jinglescode.github.io/assets/img/posts/improve-holiday-itinerary-with-machine-learning-21.webp)
Resources
Do you want to try this for your next vacation? Here’s the code. You’re welcome. 😉
Not sure where to visit in Greece or Amalfi? Go ahead and use our Greece x Amalfi itinerary.
Not sure where to visit in New York City?
Thanks for reading. 😃
Hope you enjoyed reading this article as much as I did preparing it.

Top comments (0)