
Summary: This post is about the benefits and drawbacks of using raw, logged, and normalized data for interpreting coefficients of multiple linear regressions.
Coefficients, in this case, are the numbers in front of X, represented by the letter B, in a multiple linear regression equation.
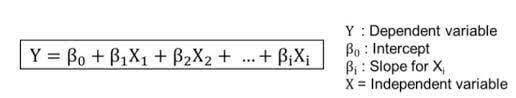
-image from towardsdatascience.com
See an example of a statsmodels Ordinary Least Squares Regression Analysis with coefficients below:

The coefficients provide insight into how certain features impact the slope of the trend line in a multiple linear regression. They are important for understanding which features correlate well with the dependent variable and how much they influence the slope of the model.
However, interpreting the coefficients is not simple and they shouldn't be accepted at face value.
For example, after logging, normalizing, and modeling numerical data on a King County Housing data set, I noticed that an increase in square footage strongly influenced the price of a house in positive terms, while adding a bedroom influenced the price in negative terms. Interpreting this at face value, it could be said that adding bedrooms will decrease the price of a home. However, knowing that this is likely not true based on background knowledge, and the fact that adding a bedroom would typically add square footage, it can be surmised that the negative correlation for bedrooms to price is likely the result of a conflating variable, such as location. I'm imagining a lot of homes with fewer bedrooms that are closer to city-centers in King County with higher prices causing this trend.
- For this model, I was thinking about how dividing an existing room into two bedrooms would decrease price, as square footage would stay constant. So, maybe don't divide an existing room into two bedrooms in your next home remodel.
This is a good example of how understanding source data of the coefficients allows them to be interpreted accurately.
In addition, linear models can be built of a combination of raw, logged, and normalized data, so coefficients need to be interpreted differently in each case. I like having models where all predictors or features are raw, logged, or normalized. And, I like having one of each model, because each type of data has its own benefit.
Raw data provides the most insight into actual or real change in the dependent and independent variables because the coefficient can be read to mean a certain value change in the independent variable for a given change in the dependent variable. For example, in the King County housing data set I referred to earlier, the price of a house increased by $211.46 for each additional square foot. This coefficient is easy to use in a non-technical presentation.

When I used logged data, it allowed me to determine the percent change. See this web page by UCLA's Advanced Research Computing, Statistical Methods and Data Analytics team.
For example, I could say that an increase of 0.66% in square footage would lead to a 1% increase in price. Or, in simpler terms, an increase in square footage of 7% would increase the price of a home by more than 10%. This could also be a helpful metric for a non-technical audience.
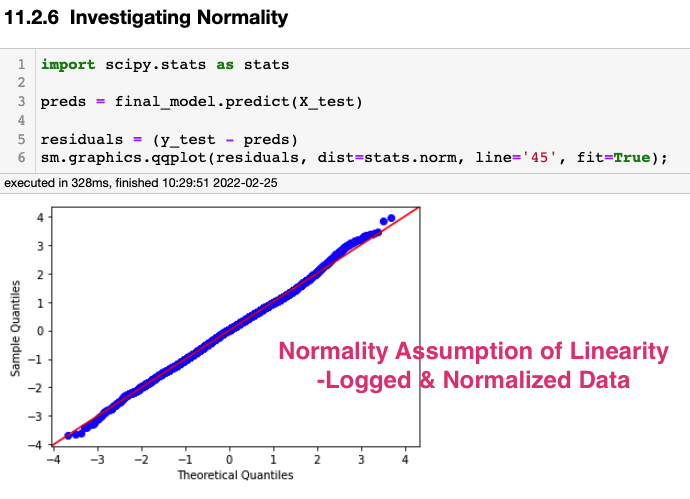
However, when building a predictive model, that doesn't need to produce coefficients for a non-technical audience, it is often best to produce models with logged and normalized data. The manipulated data allows the model to fit the assumptions of linearity, especially in regards to normality and heteroscedasticity, and for the magnitude of the coefficients to be directly compared to each other.
See how the assumptions of linearity can only be met in this model with logged and normalized data.
Logged and Normalized Data:

Raw Data:


It is apparent, above, that this is true for the King County housing data set, in which the logged and normalized data led to a model that met the assumptions of linearity and produced coefficients that showed square footage had a more positive influence on price than bathrooms, bedrooms, year built, or floors. However, it should be noted that this model did not provide a way to determine how much square footage would need to be added to equal the addition of one bathroom. A model built on raw data would be better for interpreting real value changes in the dependent and independent variables.
In sum, models that are built on raw, logged, and normalized data each have different strengths, weaknesses, and methods for interpretation. Using a combination of the data types is best when trying to build inferential and predictive models as each model can communicate the influence of features in different terms. And, having background knowledge that helps explain certain unexpected trends is helpful, if not critical.
After writing this post, I realized that people would likely want to know what they should do to improve the price of their home. Most surprising for me was that interior upgrades, especially in regards to the condition of the whole home, can have a dramatically positive influence on home price. Other remodel tips gleaned from the data set were to create a view - maybe add or increase the size of a window or build a deck, and to add livable square footage - maybe by converting a garage to living space.
In terms of metrics from the raw coefficients:
- Every increase in 1 square foot, the price increased by 211.46 dollars. This is an increase of 105,730.00 dollars for every 500 square feet.
In log terms, a 6.7% increase in square footage corresponded to a 10% increase in home price.
For every additional bedroom, the price decreased by 42,200 dollars. This is an issue in the model because homes with fewer bedrooms are likely to cost more than homes with more bedrooms - likely conflated by other variables such as location.
For each additional bathroom, the price of a home increased by $55,570.

Top comments (1)
Renovation projects breathe new life into homes, turning outdated spaces into modern havens. From transforming kitchens to updating bathrooms, the process often unveils unexpected challenges. Amidst the chaos, having reliable professionals is crucial, including services like Emergency Plumbers in Sevenoaks ensuring unforeseen plumbing issues are promptly addressed. These skilled experts play a vital role in the renovation journey, providing swift solutions and preventing potential disasters. Ultimately, a successful renovation not only enhances aesthetics but also prioritizes functionality and safety, with Emergency Plumbers in Sevenoaks serving as indispensable allies in the process.