
A centralised logging management solution like: Splunk, Datadog, Sumologic, etc. enables organisations to collect, analyse, and display logs through a single pane of glass.
In this article we will see how application logs can be sent to Splunk from lambda using Kumologica Splunk node.
Kumologica is a free low-code development tool to build serverless integrations. You can learn more in this medium article
Use case
In this use case we have a mobile app application that consumes a Mobile Channel API. Behind the mobile API we have an Order FulFilment API. The Mobile API invokes the Order FulFilment API for completing the process. When the mobile app sends the very initial request it has a Tracking id. The Tracking id traverses from the Mobile Channel API to Order FulFilment API and back.
The message passed across both applications needs to be traced based on the Tracking id in Splunk.

Prerequisite
Kumologica designer installed in your machine. https://kumologica.com/download.html
Splunk cloud Trial account
Implementation
For the above mentioned use case we will be creating two API’s , a Mobile Channel API and an Order FulFilment API.
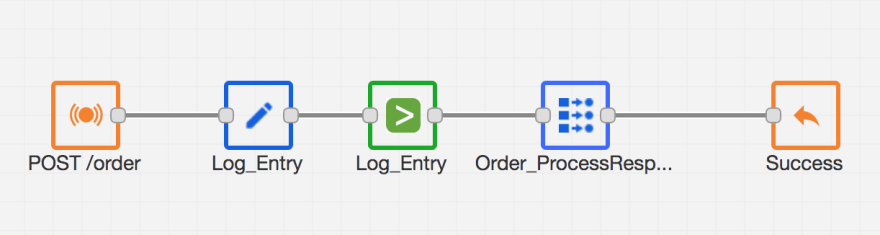
Order fulfilment API
1 . Open the Kumologica designer and Create a New project. And provide the name of the project as OrderFulFilmentService
2 . Remove the default hello world flow.
3 . Drag and drop EventListener Node from the pallet to the canvas and open the EvenListener node settings and configure the following.
    Display Name : POST /order
    Event Source : Amazon API gateway
    Verb : POST
    URL : /order
4 . Add Splunk Node from Logging category.
By default Splunk Node will not be available as part of the default Logging category.
In order to install the Splunk node , Go to Add More Nodes Option on the bottom of the pallet and click Install Splunk. Once Installation is completed a restart of the Designer will be required. Open the Splunk Node settings and configure the following.
    Display Name : Log_Entry
    Host : hostname of your splunk trial account
    Port : 8088
    Message : {“TrackingID” : msg.payload.TxnID,”ServiceName”:”Order_FullFillment”, “Data”: msg.payload }
    Splunk HEC Token : Splunk HTTP Event collector Token
5 . Wire the EventListener Node to the Splunk Node.
6 . Drag and drop Datamapper node from the palette to the canvas.
We are using the Datamapper node to mimic the response after an Order processing.
Open the Datamapper settings and configure the following.
    Display Name : Order_ProcessResponse

    Mapping : {
                “TrackingID” : msg.payload.TxnID,
                “OrderID” : msg.payload.OrderID,
               “Status” : “Processed”
              }
If you are not familiar using the DataMapper node then would recommend to go through the following article.
7 . Wire the Splunk Node to the DataMapper Node.
8 . Add the EventListener End node from the palette to the canvas. Open the settings and configure the following.
    Display Name : Success
    Payload : msg.payload
With this we have completed the development of our Order FulFilment API.
Now let’s deploy the API as a lambda to your AWS account. If you are not familiar with the deployment of a Kumologica flow I would recommend to have a walkthrough on the following medium article.
Note : Copy the service url that you receive on the terminal after a successful deployment.
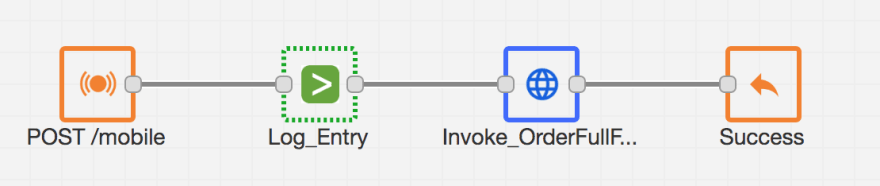
Mobile Channel API
1 . Open the Kumologica designer and Create a New project. And provide the name of the project as MobileChannelAPIService
2 . Remove the default hello world flow.
3 . Drag and drop EventListener Node from the pallet to the canvas and open the EvenListener node settings and configure the following.
    Display Name : POST /mobile
    Event Source : Amazon API gateway
    Verb : POST
    URL : /mobile
4 . Add Splunk Node from Logging category.
By default Splunk Node will not be available as part of the default Logging category.
In order to install the Splunk node , Go to Add More Nodes Option on the bottom of the Pallet and click Install Splunk. Once Installation is completed a restart of the Designer will be required. Open the Splunk Node settings and configure the following.
    Display Name : Log_Entry
    Host : hostname of your splunk trial account
    Port : 8088
    Message : {“TrackingID” : msg.payload.TxnID,”ServiceName”:”Mobile_Channel”, “Data”: msg.payload }
    Splunk HEC Token : Splunk HTTP Event collector Token
5 . Wire the EventListener node to the Splunk Node.
6 . Add the HTTP Req node from the web category in the palette to the canvas. Open the settings and configure the following.
Display Name : Invoke_OrderFulFilmentService
Method : POST
Url : your order service url. Configure this once Order FulFilment Service is deployed and you receive the url .
Return : a UTF-8 string
Response Timeout : 120000ms (default)
Authentication : None
7 . Wire the Splunk Node to the HTTP Req node.
8 . Add the EventListener End node from the palette to the canvas. Open the settings and configure the following.
    Display Name : Success
    Payload : msg.payload
With this we have completed the development of our Mobile Channel API.
Now let’s deploy both the services separately as two different lambda in your AWS account.
Testing
For testing purposes I am sending the following request as input to the Mobile API.
    {
    “OrderID”: “APQ-00001”,
    “TxnID” : “0948939-AWHDH”,
    “Item” : {
    “Name” : “ABC Laptop”,
    “Type” : “Mini-5”,
    “Qty” : 1
    },
    “Address” :{
    “Unit” : “9”,
    “Street” : “TTK Street”,
    “Road” : “Tower Road”,
    “State” : “NSW”,
    “Country” : “Australia”,
    “PIN” : 94839
    }
    }
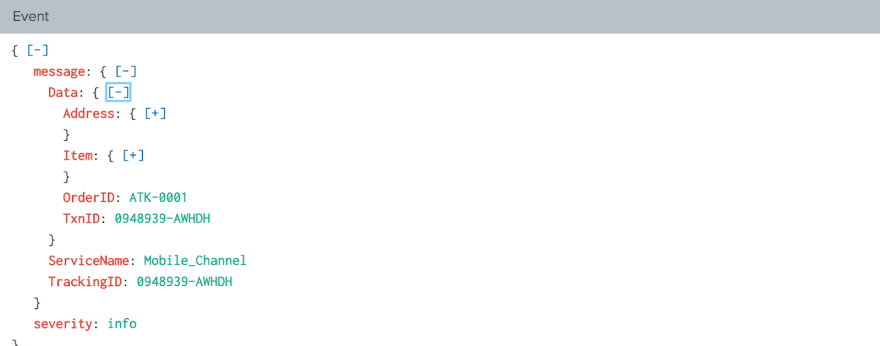
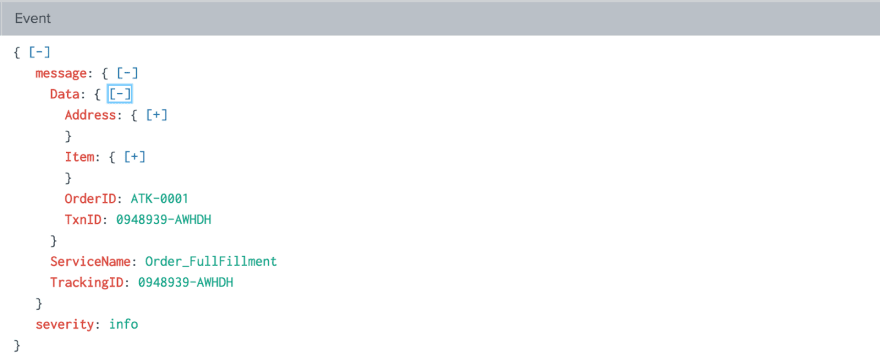
After you invoke the mobile channel API and when you search in Splunk with the TxnID value as the search parameter
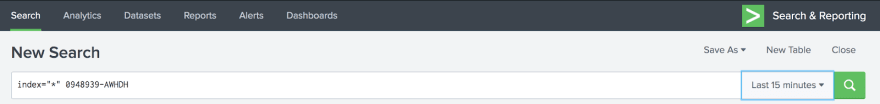
you would get the following log entries.
If you want to try out this application quickly you can import the loan broker flow from this project’s repo.
Summary
Thanks for reading and I hope you enjoyed this use case and appreciate how simple it is to implement an orchestration service with Kumologica. We would love to hear your feedback, and don’t hesitate to contact us if you have any questions.
To learn more about Kumologica checkout our official documentation at kumologica.com and subscribe to our youtube channel

Top comments (0)