Prometheus is an open-source monitoring tool for collecting metrics from your application and infrastructure. As one of the foundations of the cloud-native environment, Prometheus has become the de-facto standard for visibility in the cloud-native landscape.
How Prometheus Works?
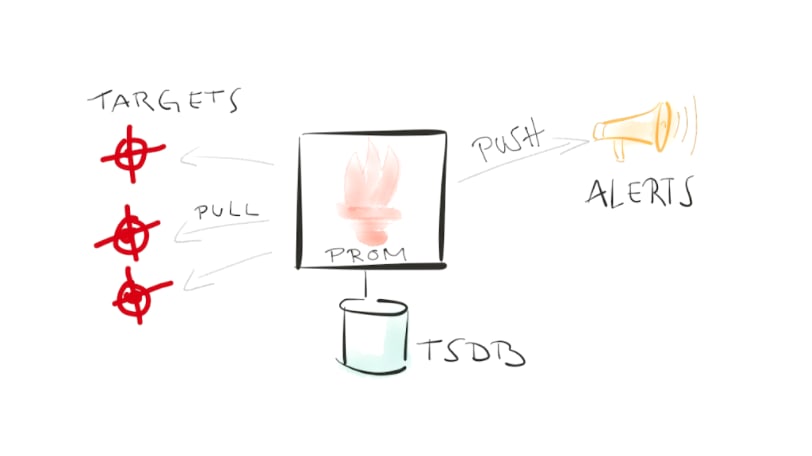
Prometheus is a time-series database and a pull-based monitoring system. It periodically scrapes HTTP endpoints (targets) to retrieve metrics. It can monitor targets such as servers, databases, standalone virtual machines, etc.
Prometheus read metrics exposed by target using a simple text-based exposition format. There are client libraries that help your application to expose metrics in Prometheus format.
Prometheus Metrics
While working with Prometheus it is important to know about Prometheus metrics. These are the four types of metrics that will help in instrumenting your application:
- Counter (the only way is up): Use counters for counting events, jobs, money, HTTP request, etc. where a cumulative value is useful.
- Gauges (the current picture): Use where the current value is important — CPU, RAM, JVM memory usage, queue levels, etc.
- Histograms (Sampling Observations): Generally use with timings, where an overall picture over a time frame is required — query times, HTTP response times.
- Summaries (client-side quantiles): Similar in spirit to the Histogram, with the difference being that quantiles are calculated on the client-side as well. Use when you start using quantile values frequently with one or more histogram metrics.
Using Prometheus
- Prometheus provides client libraries that you can use to add instrumentation to your applications.
- The client library exposes your metrics at URLs such as http://localhost:8000/metrics
- Configure the URL as one of the targets in Prometheus. Prometheus will now scrape metrics in periodic intervals. You can use visualization tools such as Grafana to view your metrics or configure alerts using Alertmanager via custom rules defined in configuration files.
Prometheus Exporters

Prometheus has a huge ecosystem of exporters. Prometheus exporters bridge the gap between Prometheus and applications that don’t export metrics in the Prometheus format. For example, Linux does not expose Prometheus-formatted metrics. That’s why Prometheus exporters, like the node exporter, exist.
Some applications like Spring Boot, Kubernetes, etc. expose Prometheus metrics out of the box. On the other hand, exporters consume metrics from an existing source and utilize the Prometheus client library to export metrics to Prometheus.
Prometheus exporters can be stateful or stateless. A stateful exporter is responsible for gathering data and exports them using the general metrics format such as counter, gauge, etc. Stateless exporters are exporters that translate metrics from one format to Prometheus metrics format using counter metric family, gauge metric family, etc. They do not maintain any local state instead they show a view derived from another metric source such as JMX. For example, Jenkins Jobmon is a Prometheus exporter for Jenkins which calls Jenkins API to fetch the metrics on every scrape.
 grofers
/
jenkins-jobmon
grofers
/
jenkins-jobmon
Prometheus exporter to monitor Jenkins jobs
Jenkins Jobmon
![]()
Jenkins exporter for Prometheus in python.
It uses Prometheus custom collector API, which allows making custom collectors by proxying metrics from other systems.
Currently we fetch following metrics:
| Metric | Type | Description | Labels |
|---|---|---|---|
jenkins_job_monitor_total_duration_seconds_sum |
Gauge | Jenkins build total duration in millis |
jobname, group, repository
|
jenkins_job_monitor_fail_count |
Gauge | Jenkins build fail counts |
jobname, group, repository
|
jenkins_job_monitor_total_count |
Gauge | Jenkins build total counts |
jobname, group, repository
|
jenkins_job_monitor_pass_count |
Gauge | Jenkins build pass counts |
jobname, group, repository
|
jenkins_job_monitor_pending_count |
Gauge | Jenkins build pending counts |
jobname, group, repository
|
jenkins_job_monitor_stage_duration |
Gauge | Jenkins build stage duration in ms |
jobname, group, repository, stagename, build
|
jenkins_job_monitor_stage_pass_count |
Counter | Jenkins build stage pass count |
jobname, group, repository, stagename
|
jenkins_job_monitor_stage_fail_count |
Counter | Jenkins build stage fail count |
jobname, group, repository, stagename
|
Usage
Configuration
Create a file config.yml using this template:
jobs
example: …Let’s build a generic HTTP server metrics exporter!
We will build a Prometheus exporter for monitoring HTTP servers from logs. It extracts data from HTTP logs and exports it to Prometheus. We will be using a python client library, prometheus_client, to define and expose metrics via an HTTP endpoint.
Our HTTP exporter will repeatedly follow server logs to extract useful information such as HTTP requests, status codes, bytes transferred, and requests timing information. HTTP logs are structured and standardized across different servers such as Apache, Nginx, etc. You can read more about it from here.
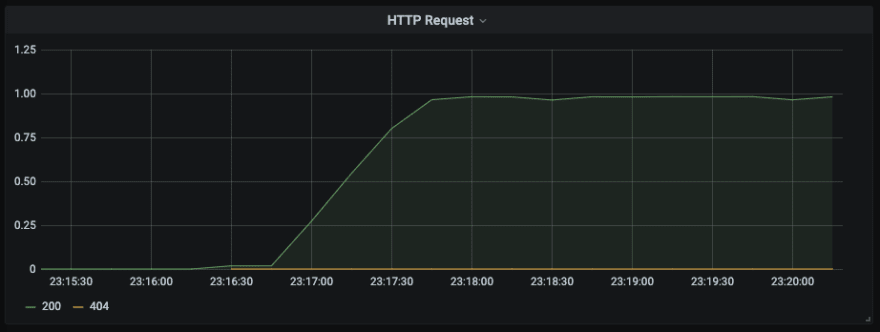
127.0.0.1 user-identifier frank [10/Oct/2000:13:55:36 -0700] "GET /apache_pb.gif HTTP/1.0" 200 2326
- We will use a counter metric to store the HTTP requests using status code as a label.
- We will use a counter metric to store bytes transferred.
Here is the script which collects data from apache logs indefinitely and exposes metrics to Prometheus :
The follow_log function tails apache logs stored var/log/apache in your system infinitely. gather_metrics() uses a regular expression to fetch the useful information from logs like status_code and total_bytes_sent and accordingly increments the counters.
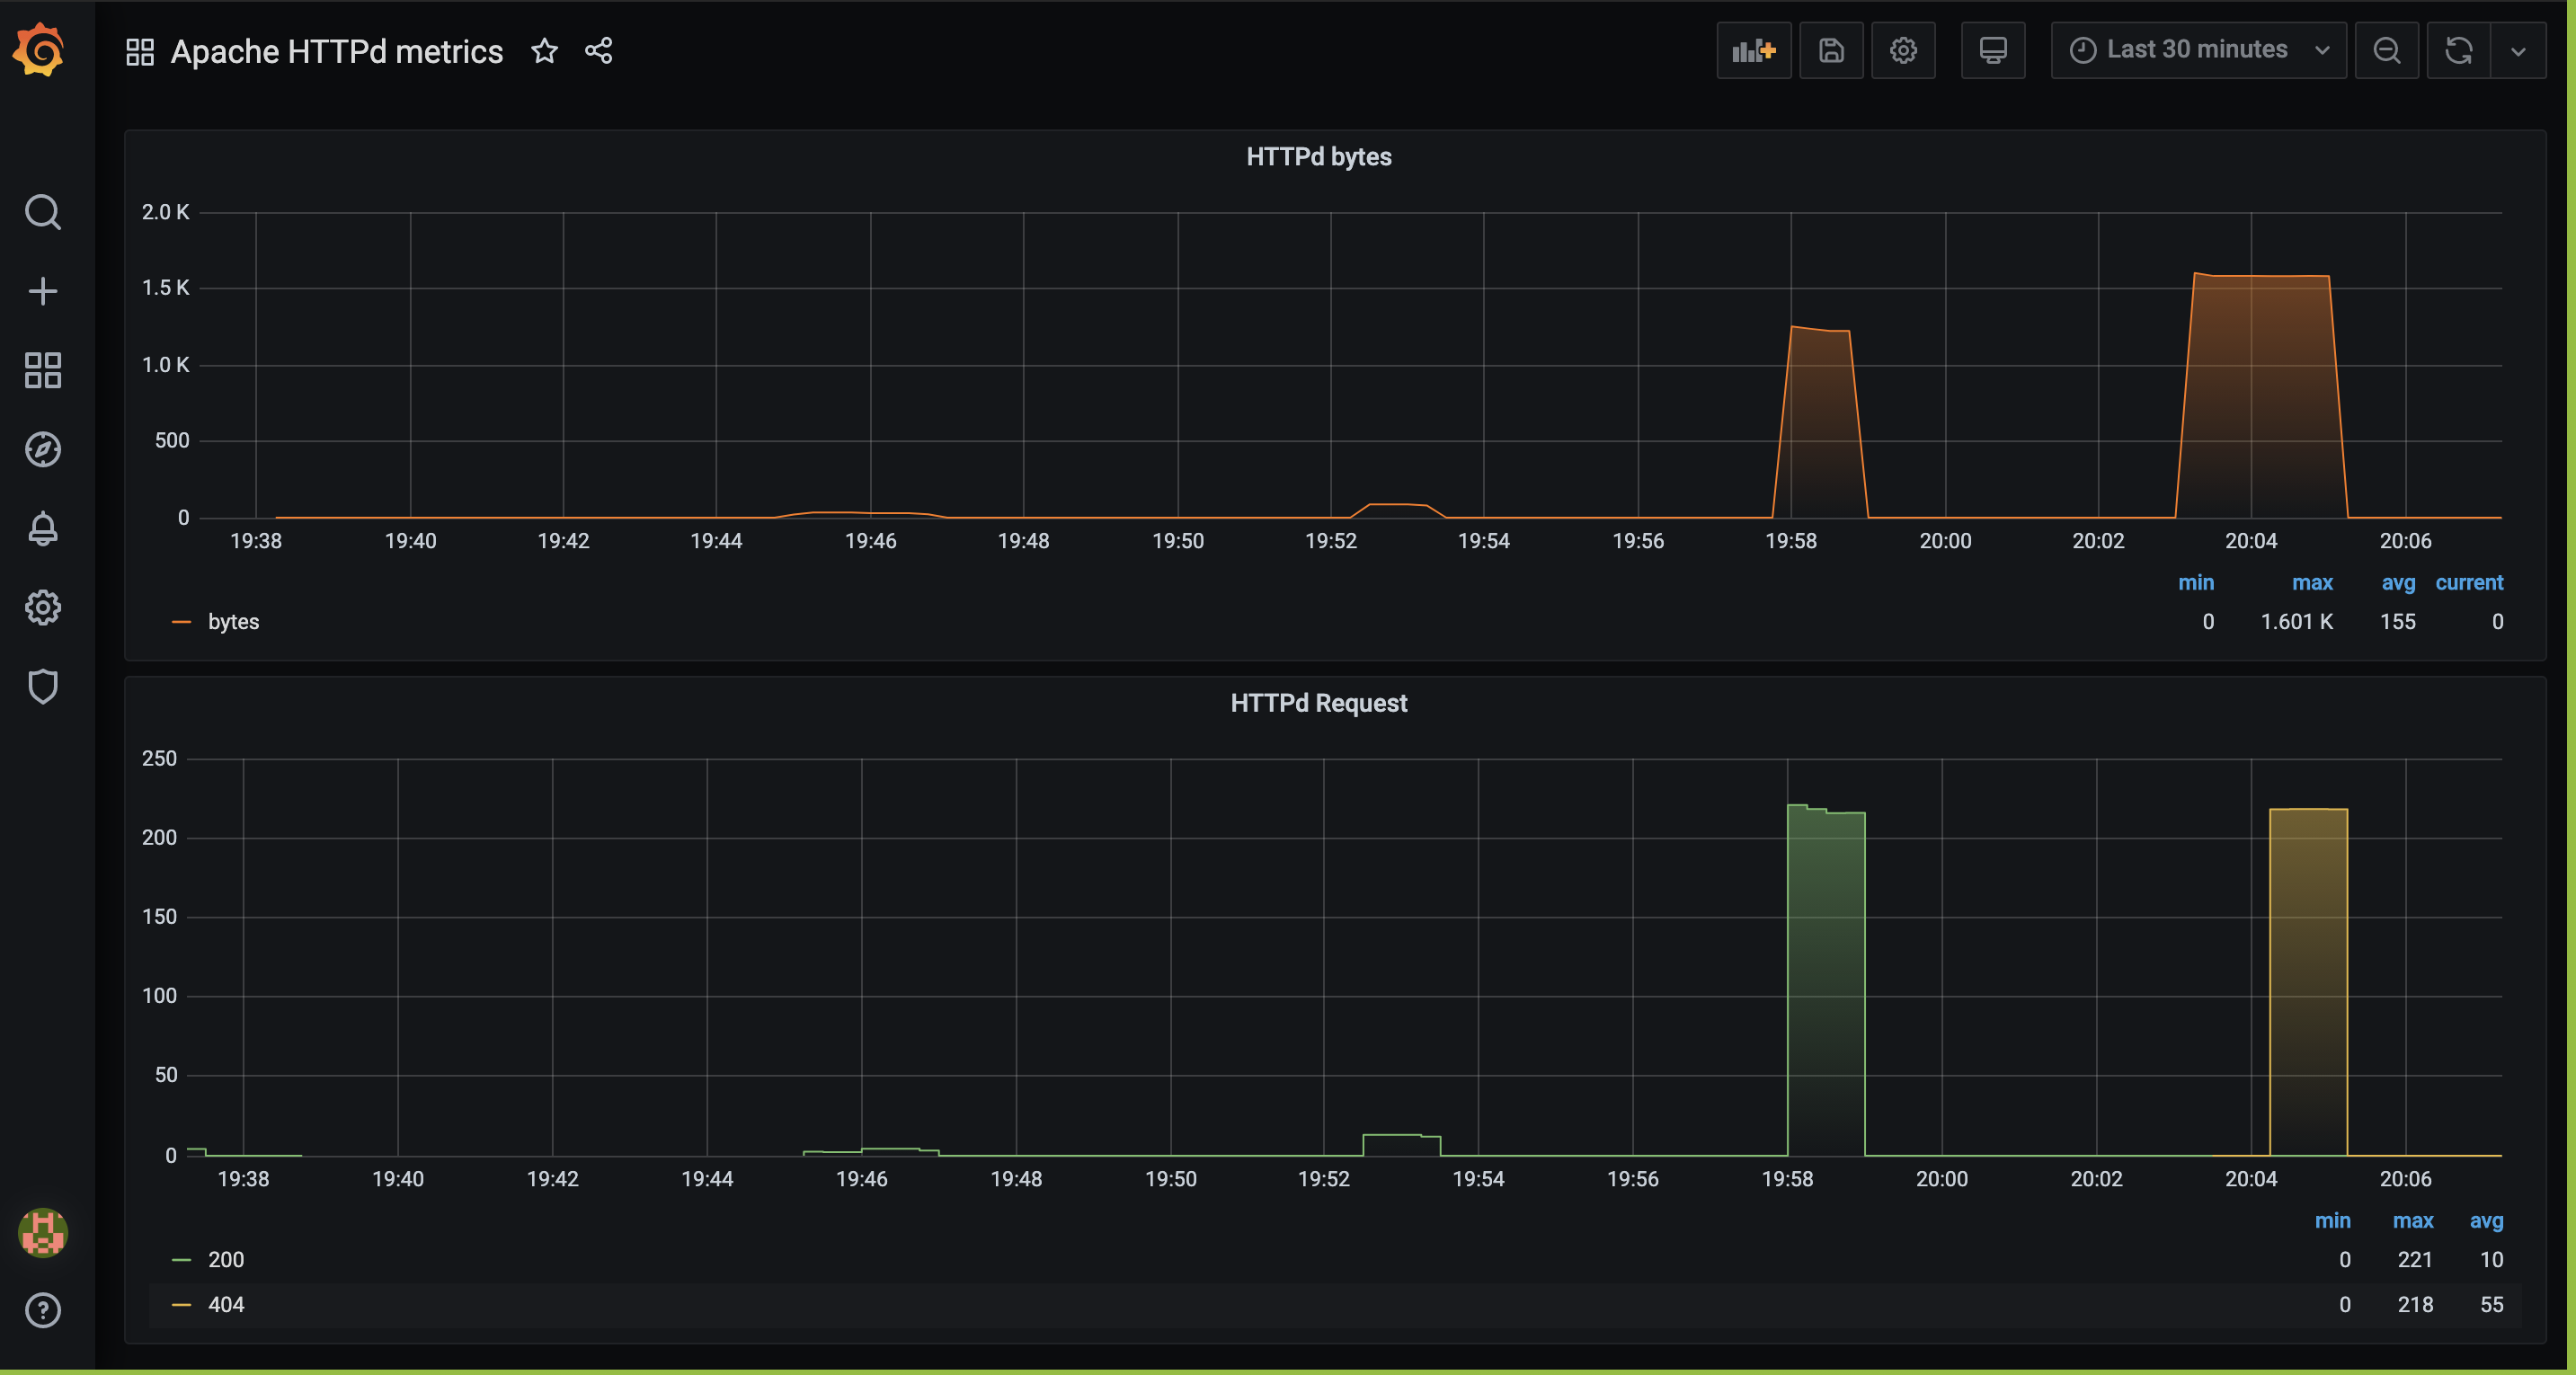
If you run the script, it will start the server at http://localhost:8000 The collected metrics will show up there. Setup Prometheus to scrape the endpoint. Over time, Prometheus will build the time-series for the metrics collected. Setup Grafana to visualize the data within Prometheus.
You can find the code here and run the exporter:
Nancy-Chauhan
/
httpd_exporter
Prometheus exporter for monitoring apache
httpd_exporter
Prometheus exporter for monitoring http servers from logs.
It extracts data from http logs and export to prometheus.
Requirements
- python 3.6 +
Usage
- Clone the repo
- Run
docker-compose up
Grafana Dashboard
Originally Posted at https://medium.com/@_nancychauhan/building-a-prometheus-exporter-8a4bbc3825f5

Oldest comments (4)
👏🏼
Thank you
superb write up!
Thank you for the encouragement