
It's been some time since I last posted an article here but what a best comeback than with a new charting library update:
LightningChart JS v.5.1 has just been released!
For developers working with data applications, LightningChart JS is the best charting library solution featuring high-end technology for lightning-fast WebGL-rendered and GPU-accelerated charts.
What's new in LightningChart JS v.5.1?
Mesh Model 3D
We’re introducing the new Mesh Model 3D chart type for rendering complex 3D geometries at high performance.

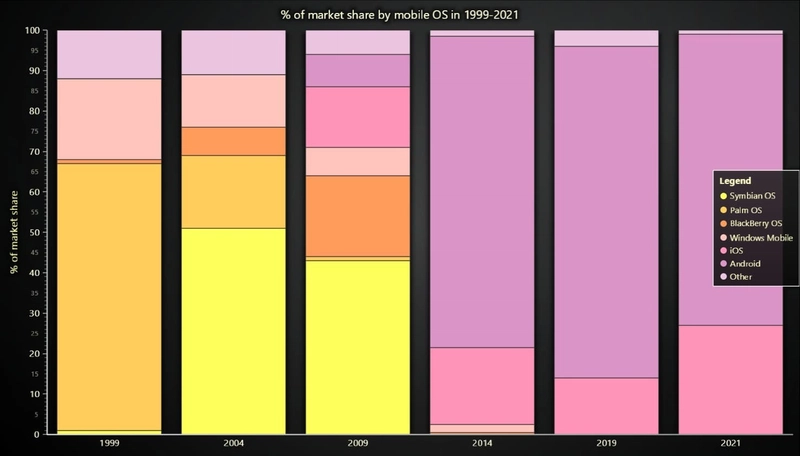
Bar Charts
We’re adding two new bar charts: stacked and grouped bar charts.
New features
- Percentage-based color lookup tables
- Axis Interval Restriction API (Beta)
- Axis Default Interval API (Beta)
- Date Time Axis – UTC mode (Beta)
Introducing a new time series React component

The react-time-series-chart is a powerful open-source React component for interactive and heavy-duty Time Series Charts
This was LightningChart JS v.5.1 in a nutshell. For more information, refer to the official release note.
Get LightningChart JS
Written by:
Omar Urbano | Software Engineer & Technical Writer
Reach out to me via LinkedIn

Top comments (0)