I’m learning more about DevOps stuff, so I’ve been looking into monitoring solutions used in large enterprise environments.
Dynatrace is an “all-in-one intelligence platform”, which is marketing-speak for monitoring, analytics, and reporting, though it does a bit more than that. Enterprises use it to monitor system load statistics from servers, containers, and cloud platforms, as well as individual application monitoring, tracing, network performance, and continuous delivery testing. It supports piping in metrics from other providers, too.
Once set up, metrics are available in one place to build dashboards, analyze with queries, generate reports, and other businessy things.
The documentation for getting started could be better, so I’m writing down my setup process for testing and some cool things you can do.
Setup
The first thing you’ll need to do is sign up for the free trial. It’s 14-day, no card required, so you won’t get stuck with a surprise enterprise-level bill for monitoring your 2-player Factorio server.
For testing, I recommend the virtual machine route, or Docker container.
Install in a VM
I installed the Dynatrace OneAgent on an Ubuntu VM that I spun up using Multipass. If you follow the same route I did and you have an M1 Mac, make sure you use the ARM (AARCH64) version of OneAgent, otherwise it won’t install.
- Once you’ve got your VM or dumpster-sourced Linux box running, log in to your Dynatrace account. If the panel doesn’t automatically load the “Deploy Dynatrace” page, you’re about to discover the UX wonder called “The Dynatrace Menu”. Click the hamburger icon at the top left of the page, and then head to Favorites → Deploy Dynatrace :
Once you’re there, click the Start installation button in the bottom right corner.
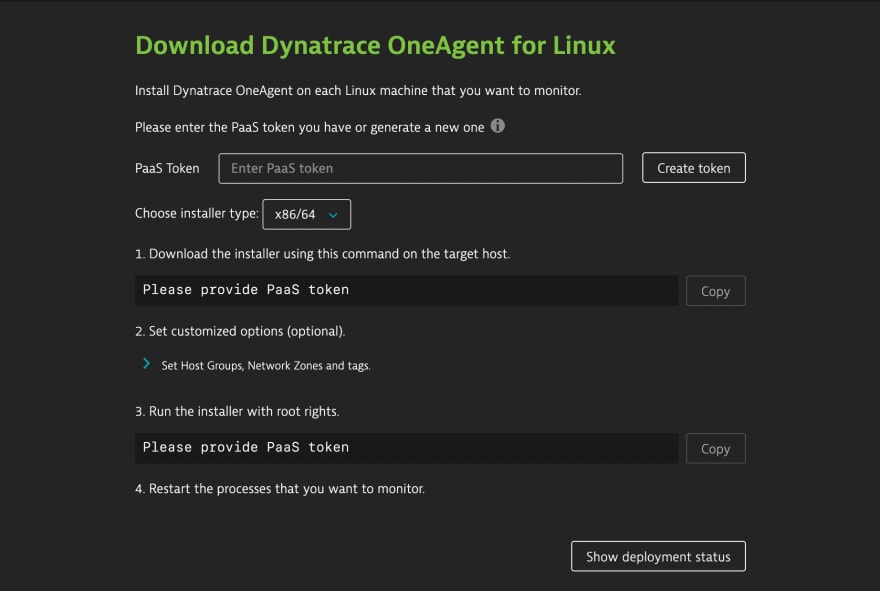
On the Install OneAgent page, select the Linux platform, and you’ll be presented with this page:
You’ll need to generate a PaaS token, which you can do by clicking the Create token button on the right.
Once you have a PasS token, the installer page will give you three commands to copy and paste into your VM’s shell, in order. The first one downloads the installer, the second one verifies the signature, and the last one runs the installer. You’ll need to run the last one as root.
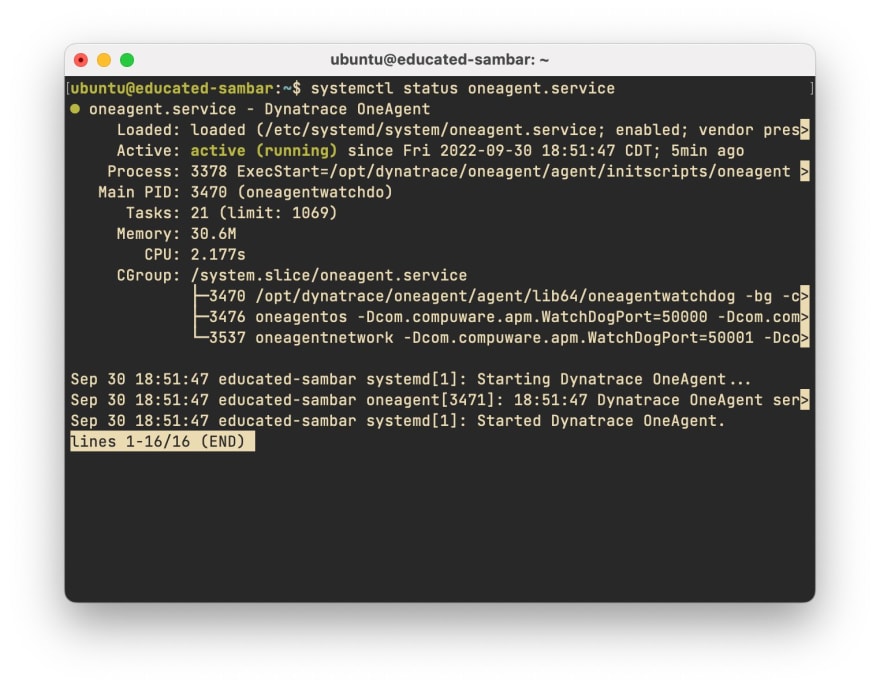
When it’s done installing, your shell should look similar to mine:
You can verify OneAgent is running with systemctl status oneagent.service:
Viewing host performance
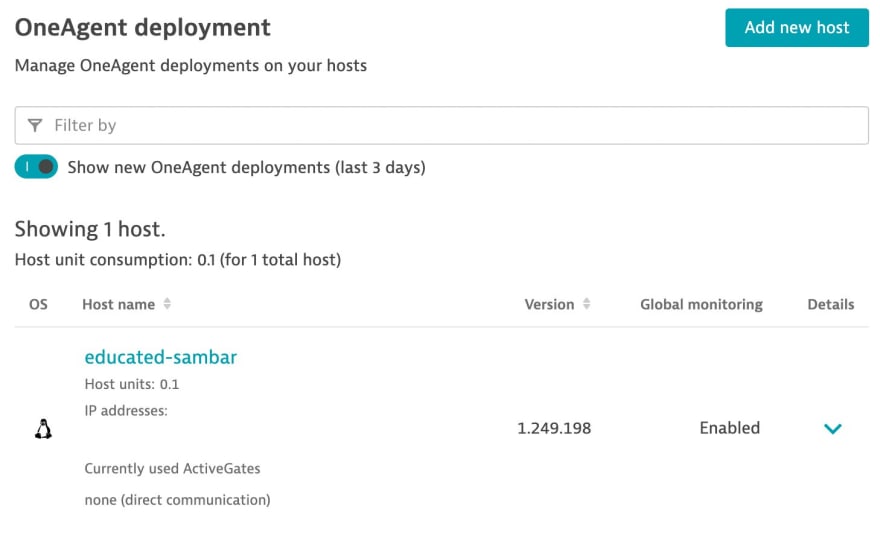
Back to your browser, click the Show deployment status button on the lower right of the page, and after a small delay your VM will show up on the page:
Click your host to head over to the details page, where you’ll see some quick stats like CPU, memory usage, and availability.
Note: If you see the “improved version” banner at the top of the page, enable it for the new panel design. Now the page should look like this:
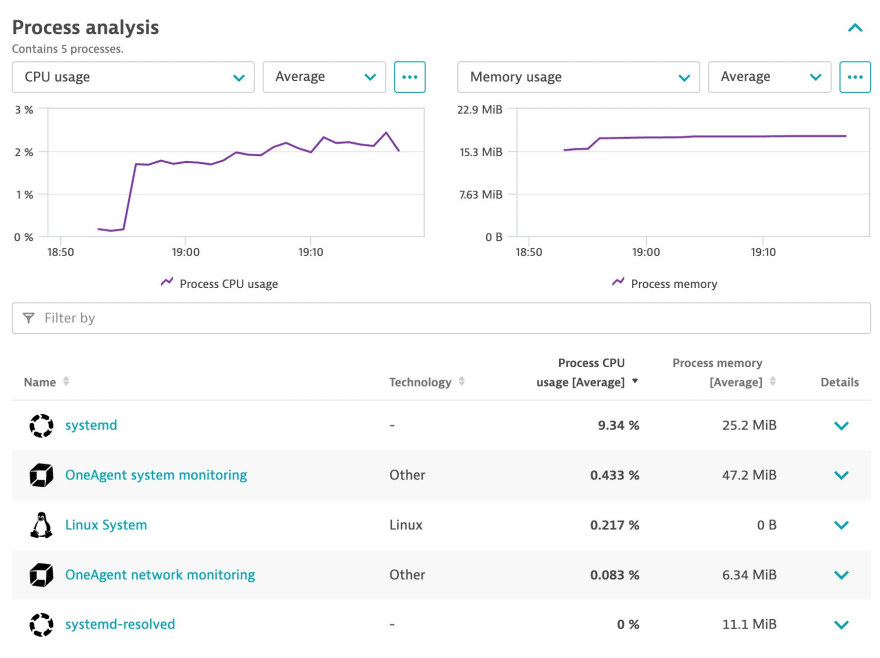
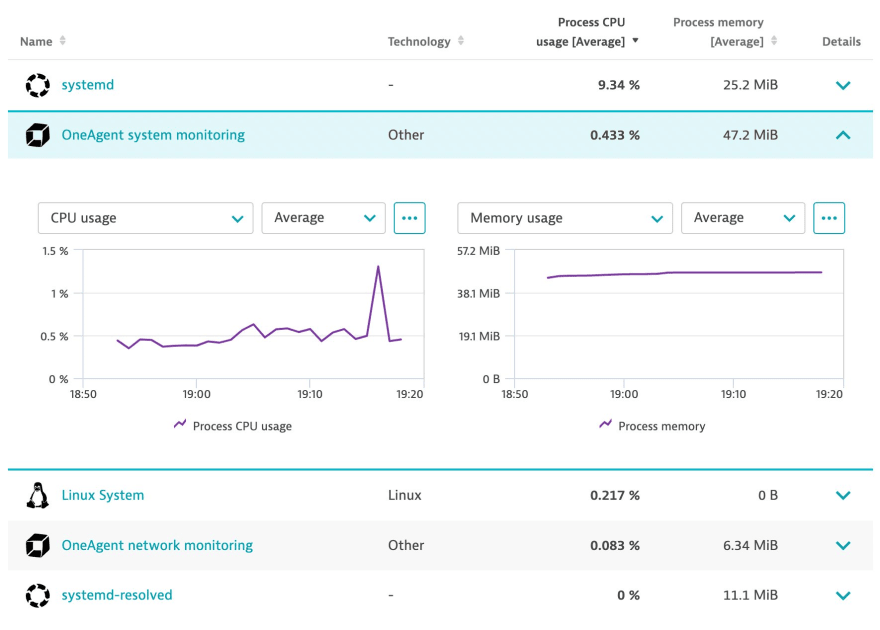
Now you’ve got some pretty graphs! My favorite part though is the process analysis area, which saves me a trip to htop:
You can also dive into a single process and see its usage history:
Working with dashboards
Now imagine you’ve got several hundred of these VMs running (I recommend not imagining the bill). Going to each page is inefficient at best, so let’s make a dashboard to view infrastructure status at a glance.
Create a new dashboard
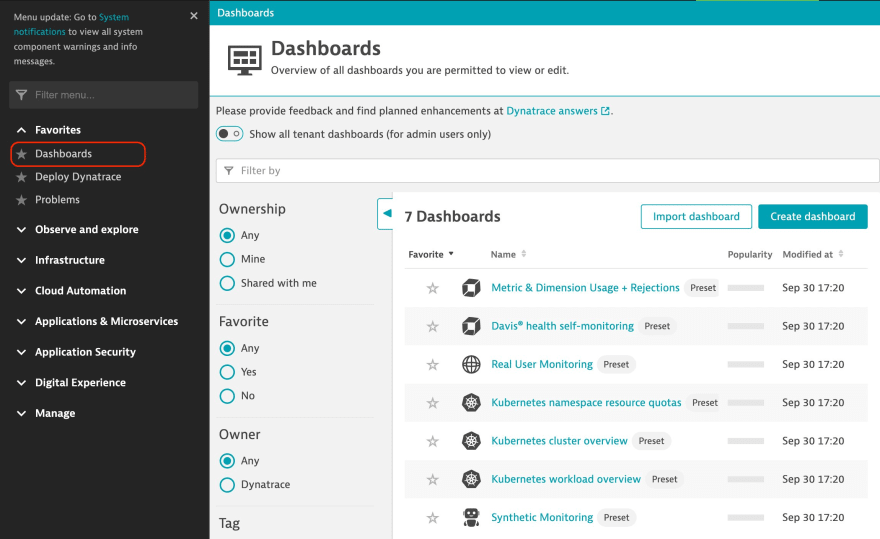
- Open the Dynatrace Menu (sidebar on the left)
- Navigate to Favorites → Dashboards
- Above the dashboards table, click the Create dashboard button
- Enter a dashboard name
- Click Create
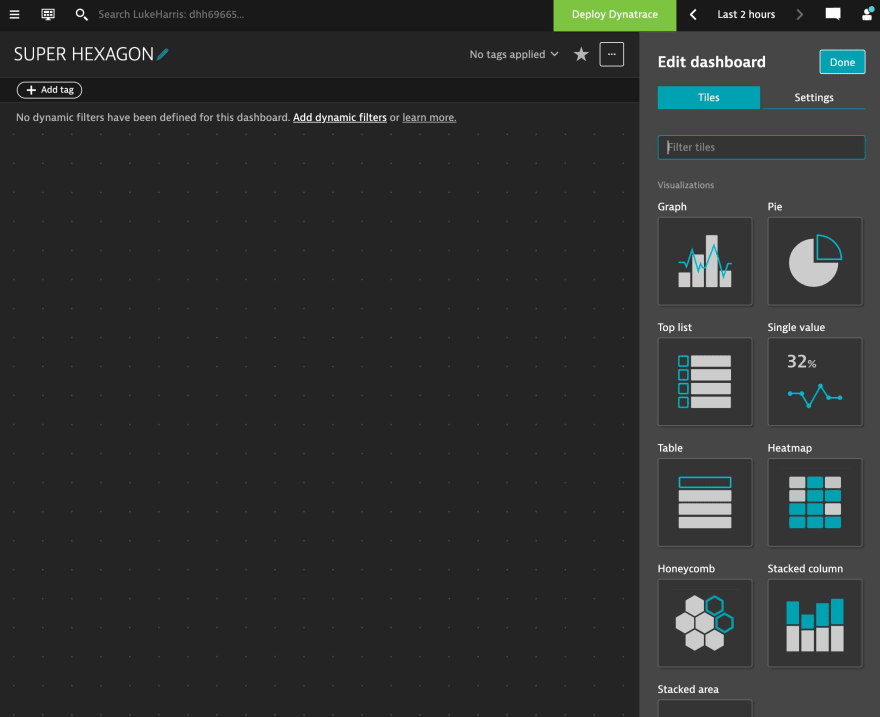
Now you should have a page like this:
Let’s add some widgets! The official tutorial recommends host health and CPU usage, so let’s start with those.
- In the sidebar on the right, find the Host health widget
- Drag and drop anywhere on the dot matrix
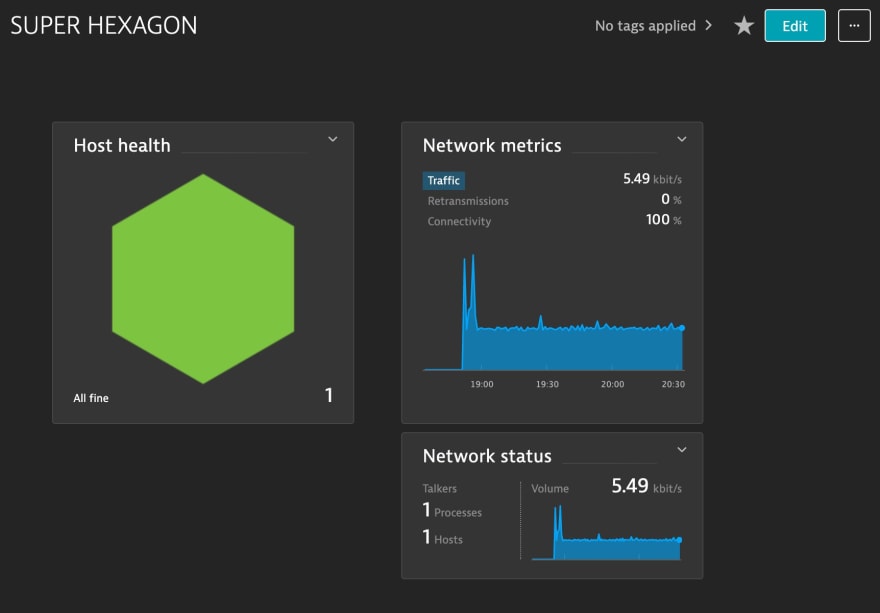
By default, this shows a hexagon per host. You can get more advanced with it and have multiple widgets for different groups, but I won’t get into that right now.
I added some network widgets, so now my dashboard looks like this:
We can add CPU usage dashboard widgets for individual hosts, so let’s add one now.
- Navigate to Infrastructure → Hosts
- Open the host we set up earlier
- Make sure you’re using the new dashboard, as recommended earlier
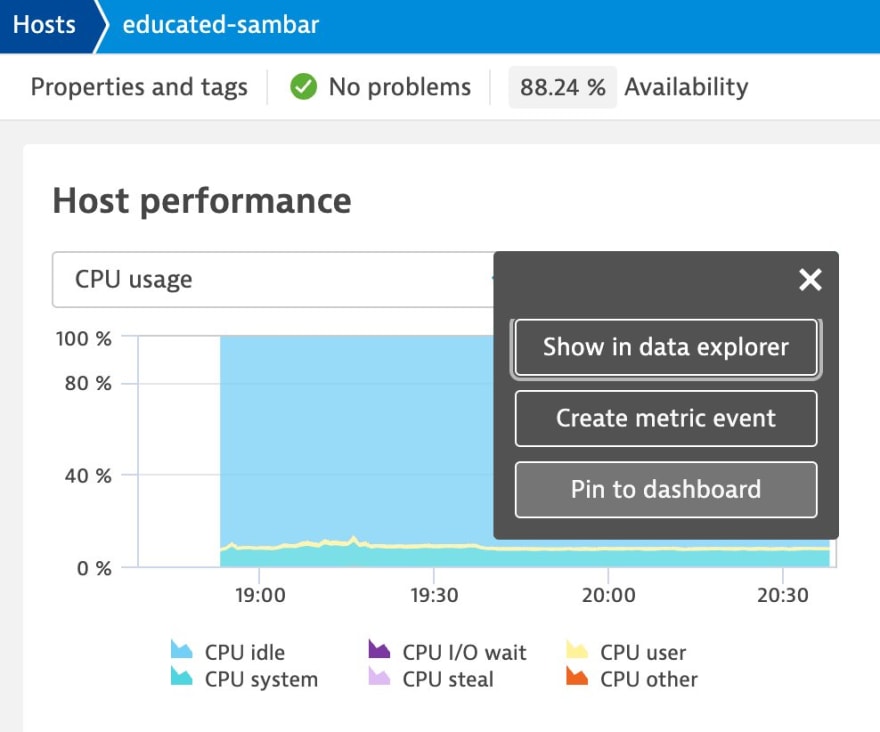
- In the Host performance group, find CPU usage , and click the three dot (•••) button to open the menu
- Click Pin to dashboard , and choose the dashboard we created earlier
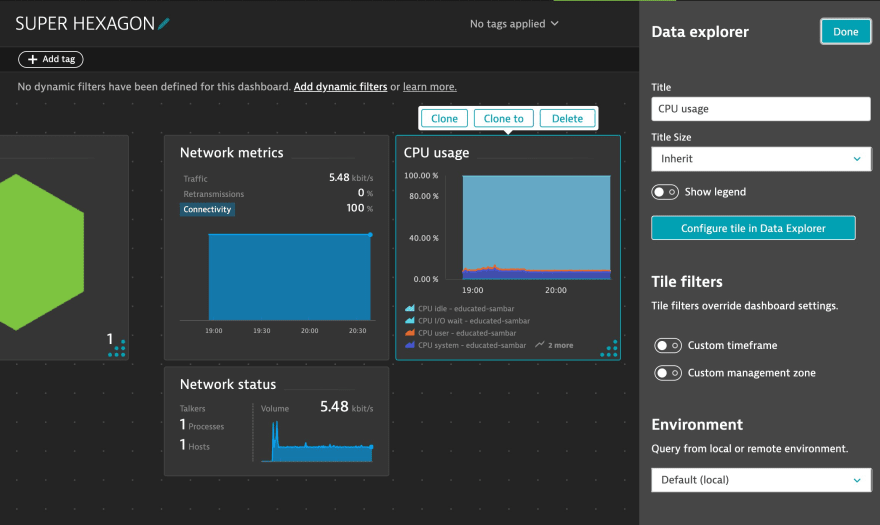
Now click the Open dashboard button to view the new CPU widget:
Advanced widgets
Let’s add some widgets for service-level objective (SLO) monitoring and server response time.
For the SLO widget:
- Find and add the Service-level objective widget to the dashboard
By default there are no SLOs created yet, so let’s go define one.
- Using the Dynatrace Menu, navigate to Cloud Automation → Service-level objectives
Since our test VM has no services running yet, let’s manually configure an SLO.
- Click Configure SLOs
- Click Add new SLO
- Give the SLO a name
- For the metric expression field, use
builtin:host.availability - Click Save changes in the floating modal on the bottom of the screen
Now we need to hook up our SLO widget on the dashboard to the SLO we just created.
- On the dashboard, click the dropdown chevron on the SLO widget and click Edit tile
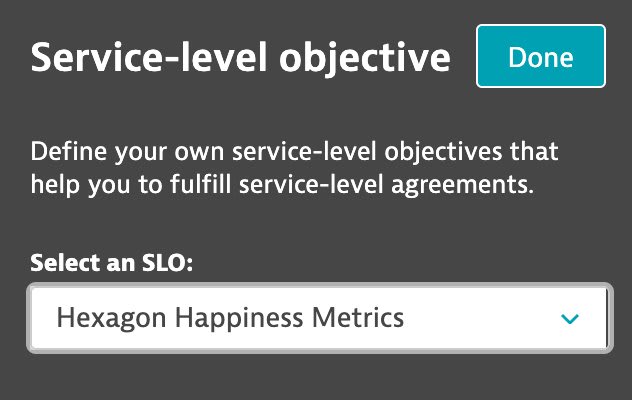
- In the sidebar on the right, select the SLO we just created:
Turn off Custom timeframe , otherwise the default of one week will reflect poorly on our young VM
Click Done
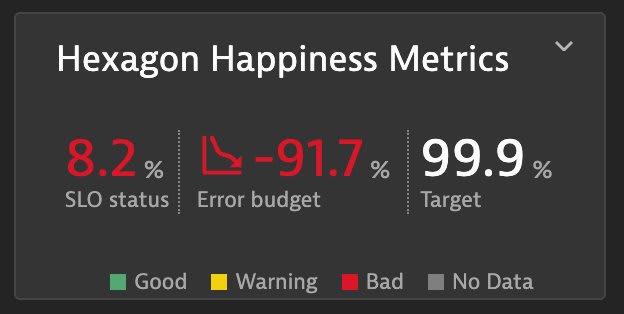
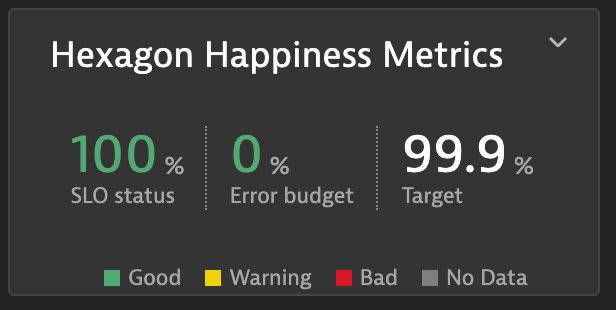
Now we can keep an eye on how well we’re hitting our SLO:
Wow, we’re failing to hit our availability metrics. The default timeframe is 7 days though, and our VM is less than an hour old at this point, so let’s adjust the timeframe: At the top right of the page, after the green Deploy Dynatrace button, adjust the timeframe to Last 30 minutes.
There we go.
Monitoring a container
Dynatrace automatically detects new Docker containers and makes them available for monitoring. Let’s spin up a WordPress container.
- Install Docker in your VM with
sudo apt install docker - Add your user to the
dockergroup:sudo usermod -a -G docker lukenewgrp docker
- Pull the WordPress image:
docker pull wordpress - Run the container:
docker run --name super-hexablog -d wordpress
To view stats about the container in Dynatrace, wait about 2 minutes, and then head over to Infrastructure → Containers :
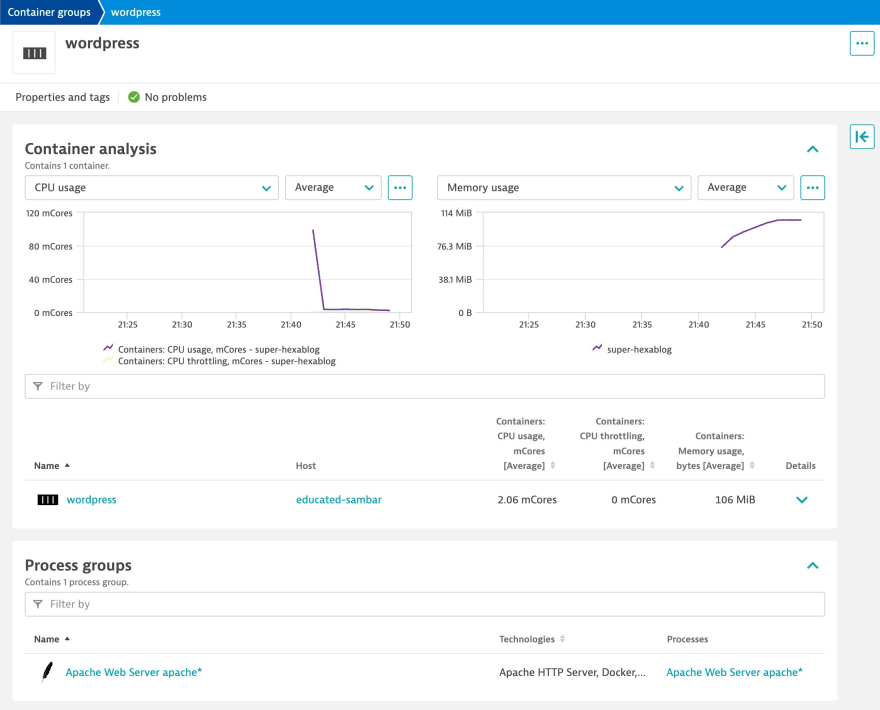
Clicking our wordpress container takes us to a performance metrics page:
Setting up problem alerting
I want to get notified when my web server crashes, so let’s set up some basic problem alerting.
- Head to Infrastructure → Technologies → Apache HTTP Server
- Click the Settings button
- Click Availability monitoring in the sidebar
- Enable Process group availability monitoring
- Under Open a new problem , select If any process becomes unavailable
And I’d like to get emailed when things catch on fire:
- Navigate to Manage → Settings → Integration → Problem notifications
- Click Add notification
- Under Notification type , select Email
- Give it a name
- Click Save changes in the floating modal at the bottom of the page
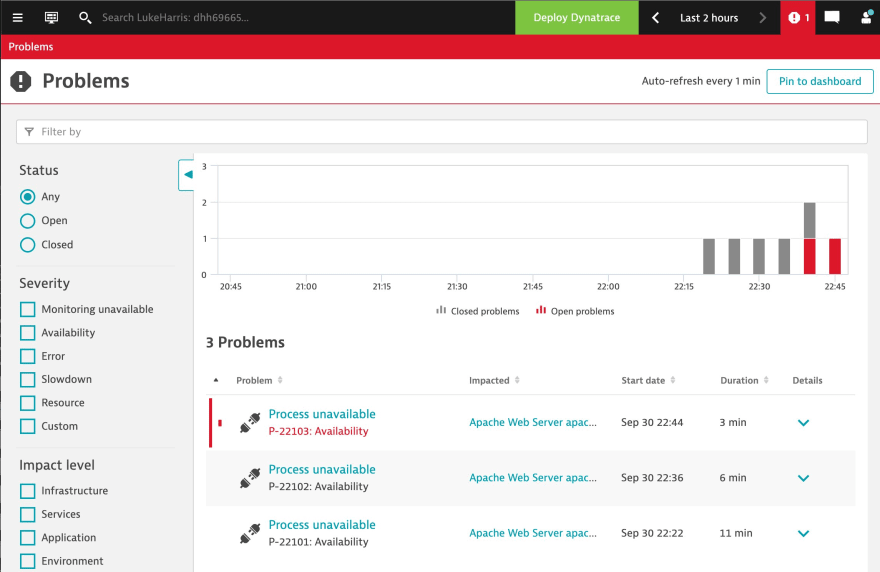
Let’s test it out! In our VM, run docker stop super-hexablog. Within about a minute, you should see a red notification at the top of the page. Clicking it takes you to the Problems view:
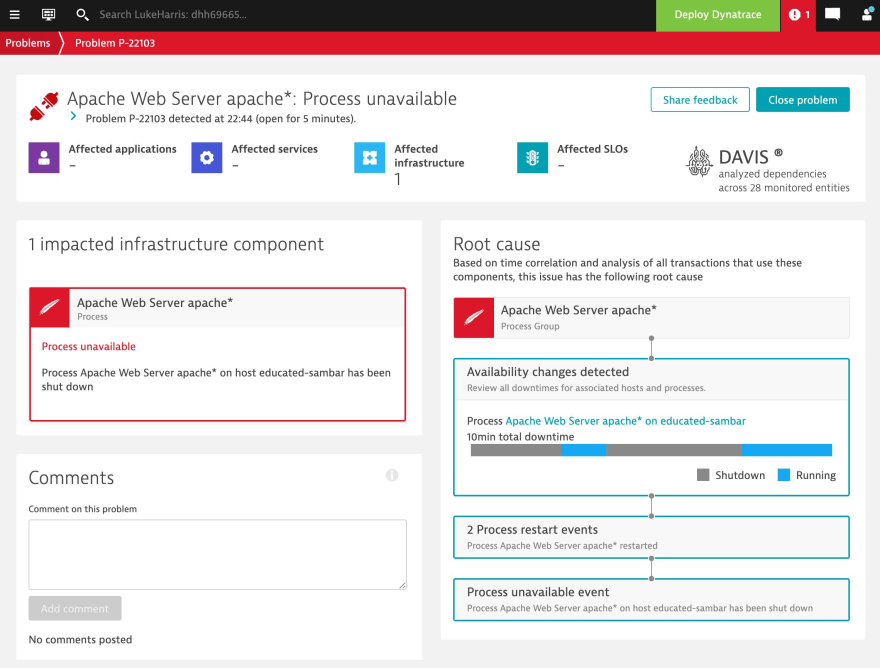
You can also drill down into problems and see what Dynatrace thinks is the root cause:
Conclusion
I really like how the Dynatrace agent can detect new things on a host with no configuration needed. And it’s easy to go from a bird’s-eye view of your entire fleet to analyzing the details of an individual process.
I plan to look at Datadog next. Prometheus + Grafana looks like a great open source option, I’m interested in seeing how they all compare. I’ve seen PromGraf used a lot for homelab setups.









Top comments (0)