Using Intel DCI (Direct Connect Interface), you can debug a whole system including the boot phase via USB cable. In this post, I'll first summarize the related technology of Intel DCI. After that, I'll show you how I setup the environment for Intel DCI Debugging on UP Squared board.
Intel DCI and its surroundings
Intel Trace Hub

(image from Using the Intel Trace Hub for at-speed printf by Alan Sguigna)
Intel Trace Hub is a mechanism that collects hardware/software events for the entire system, formats them with a time stamp, and records them in the trace destination. It acts like a PCI device and consisted of below 4 components.
- Trace Source: sources of log such as internal hw signals, SoC performance data, software/firmware trace, and debug data from the Software Trace Hub
- Trace Destination: It can be MTB, system memory, or DCI
- Global Trace Hub: routes the data from the trace sources to the trace destinations according to the user’s configuration
- Trigger Unit: controls the starting and stopping of tracing operations
In other words, DCI is possible based on log information of the entire system provided by Intel Trace Hub.
JTAG
JTAG is a mechanism to communicate with IC by serial communication. The interface specifications are defined by IEEE 11149.1, but in reality, semiconductor manufacturers extend them using private instructions and option registers. Functions such as CPU debugging and FPGA/CPLD sequences are realized using private instructions and option registers, so in many cases, only the semiconductor manufacturer and a third party that sined NDA can know.
Intel DCI
Intel DCI is a function that allows you to debug the whole system including SMM and reset vector with just USB. More specifically, this allows you to JTAG debug a Intel CPU, with a trace data sent by Intel Trace Hub via USB.
You can connect target device and the analysis PC with a USB debug cable, and run Intel System Debugger on the analysis PC to debug.

(image from OSFC 2019 - Debugging Intel Firmware using DCI & USB 3.0 by OSFC)
As you can see, there are two types of connections.
- out-of-band (DCI OOB): This method uses USB but don't use USB protocol or USB controller, so we need external adapter
- in-band (USB Debug Class): This method uses USB protocol. Supported in 7th gen and later
Intel SVT CCA (Silicon View Technology Closed Chassis Adaptor)

(image from Source Level Debugging with Intel(R) SVT CCA by Slim Bootloader)
DCI OOB requires this adapter. This allows access to JTAG or Run-Control via USB3 port on silicon or platform which DCI is enabled.
ISS (Intel System Studio)
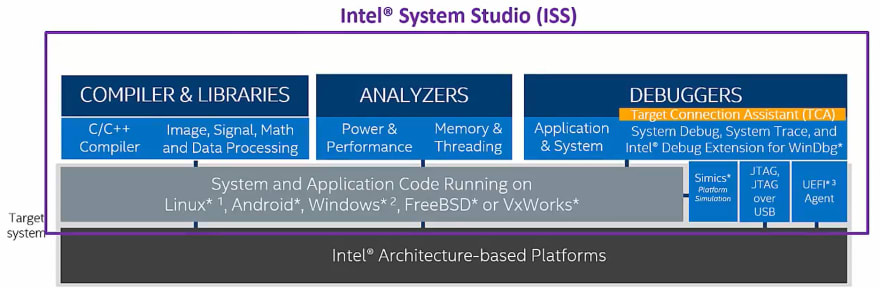
(image from Introduction of System Debug and Trace in Intel® System Studio 2018 by Intel)
You have to install Intel System Debug in your analysis PC (host PC) to debug using Intel DCI, and System Debug is part of the tools in ISS. ISS debug tools includes the followings.
- System Debug: For source-level debugging of EFI
- System Trace: Realtime capture of logs of BIOS and CSME
- Intel Debug Extension for Windbg
Methods of connecting target and host

(image from Introduction of System Debug and Trace in Intel® System Studio 2018 by Intel)
ISS provides below 3 methods to connect target and host.
- ITP-XDP3: Oldest methods. Directly connect to the JTAG socket. Costs about 3000 USD.
- CCA (Closed Chassis Adapter
- DbC (DCI USB Native Debug Class)
Setup Intel DCI Environment on UP2 board
Environment
- Windows PC that has USB 3.0 port (Host PC)
- UP Squared ATOM Quad Core 08/64 (UP2 board)
- SF100 SPI NOR Flash Programmer (SF100) + ISP Testclip SO8 (TestClip)
- UEFITool v2.8 (UEFITool)
- Ghidra
- Intel System Studio (ISS)
- USB3.0 Debug Cable (Debug Cable)
DCI Support on UP2 board
In order to use Intel DCI, your BIOS needs to support DCI. Looking at the BIOS history of UP2 board, we can see that the DCI Debug Interface is supported since UPA1AM31. However, it is disabled as a default for formal release version since UPA1AM36. My board had UPA1AM52 flashed (I found out by looking at BIOS SETUP screen), so we have to enable DCI in BIOS configuration first.
Usually, there is a configuration called HDCIEN in the BIOS SETUP, and by enabling this, it should set the bit inside IA32_DEBUG_INTERFACE MSR and enable DCI. However, on this BIOS, enabling HDCIEN which was under [CRB Setup] > [CRB Chipset] > [South Cluster Configuration] > [Miscellaneous Configuration] > [DCI enabled (HDCIEN)] doesn't seem like to enable specific bit in the IA32_DEBUG_INTERFACE.
Intel has open source BIOS image here, which is supposed to enable DCI on UP2 Atom board. However, it seems to not boot when I flash the BIOS with this image. Also, it seems like a common problem as the same problem is discussed in up2 forum.
So, I asked Tanda-san (the questioner of the above forum) how he managed to solve this problem, and he gave me a hacky solution. That is, to patch MSR initialization code to set the bit of IA32_DEBUG_INTERFACE on UP2 BIOS.
Enabling DCI on UP2 board
I used SF100 to extract/write BIOS and the method is explained in my previous post, so I will skip the details of this.
After you extracted UPA1AM52 BIOS image from UP2 board and saved as a .bin file, you can look at what kind of modules are included in that image by using UEFITool. If you look for the byte sequence b9 80 0c 00 00 (mov ecx, 0xc80 while 0xc80 is the number of MSR IA32_DEBUG_INTERFACE), you'll probably find 2 hits like below.
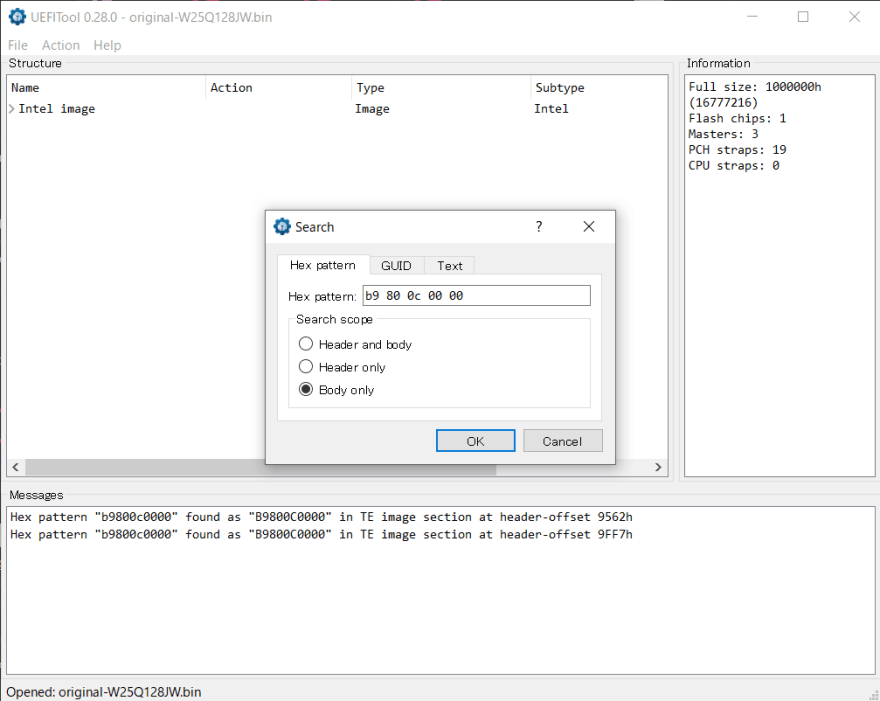
If you double click the result, youl'll find that they are both in the same PEI module.

UEFITool v2.8 can replace module in the image, but it has a disadvantage that it's hard to understand what module it is. By using different version of UEFITool, you can see that the PEI module is called SiInit PEI module.
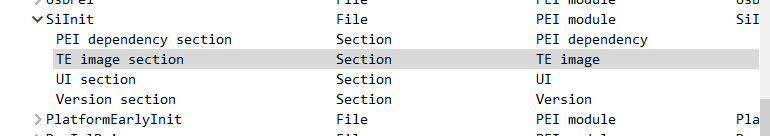
Let's extract SiInit PEI module by right clicking TE image section and selecting Extract body.
Then, we open this module in ghidra. Ghidra recognizes this module as Raw binary but just go on with it, select x86 64bit Visual Studio and analyze. After that, again, search for the byte pattern b9 80 0c 00 00.
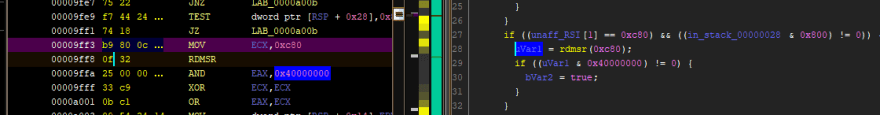
Disassembling around the first search result, you should get something like this.

We have bits that enables DCI on the first bit of IA32_DEBUG_INTERFACE, so lets modify 0x40000000 to 0x40000001 (you can patch instruction on ghidra by Ctrl-Shift-G).
Also, the second result looks like this.
Samely, modify 0x40000000 to 0x40000001.
After that, File > Export Program, set Binary as a format and save this patched PEI module to somewhere.
Now let's go back to the UEFITool and locate that SiInit module again. Right click on the TE image section and select Replace Body, then select the patched module.

Once succeeded, you'll see some Rebuild displayed on the other module but that's normal behavior, so just Ctrl-S to save this.
Now, you made the patched UPA1AM52 BIOS image that has IA32_DEBUG_INTERFACE[0] set. Flash the BIOS with this image and you are ready to go.
Intel System Debugger Setup
ISS Installation
You can download ISO installer from this download link. If you look inside iso file, you'll see some files like this.

Double click install.exe, click Next a bunch of time and install ISS.
Usage of ISS are documented in C:/IntelSWTools/system_studio_2020/documentation_2020/ (though it depends where you installed IntelSWTools). Some path of documents that I found useful are the followings.
-
Target Indicator:
documentation_2020/en/debugger/system_studio_2020/system_debugger/target_indicator/TargetIndicator.pdf -
How to connect System Debugger:
documentation_2020/en/debugger/system_studio_2020/system_debugger/system_debug/Getting_Started.pdf -
How to use System Debug:
documentation_2020/en/debugger/system_studio_2020/system_debugger/system_debug/User_Guide.pdf
Connecting Intel System Debugger
First, make sure your UP2 board is powered on. Then, on the host PC, run Intel System Debugger Target Indicator 2020. When you run Target Indicator, it seems nothings happened but it's actually executed in the background.
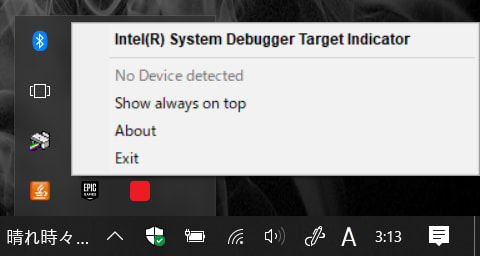
If you right click the red square icon and select Intel(R) System Debugger Target Indicator, you can check the current status of the connection.
Then, connect the UP2 board and host PC with USB3.0 debug cable (I always connect target first and then to host). UP2 board have 3 USB3.0 port and not all the port works for this. In my UP2 board, it only recognizes when I plugged it to the port below.

I had trouble recognizing it first, but after I pull out debug cable from the host, reboot the target with the debug cable still plugged in and then, connect to the host again, it worked. Other methods of solving unrecognizing issue were stated here but I haven't tried that out.
If connection works, Target Indicator should appear like follows.

Then, run Intel System Studio.

After closing the "Getting Started", we'll define connection like follows.

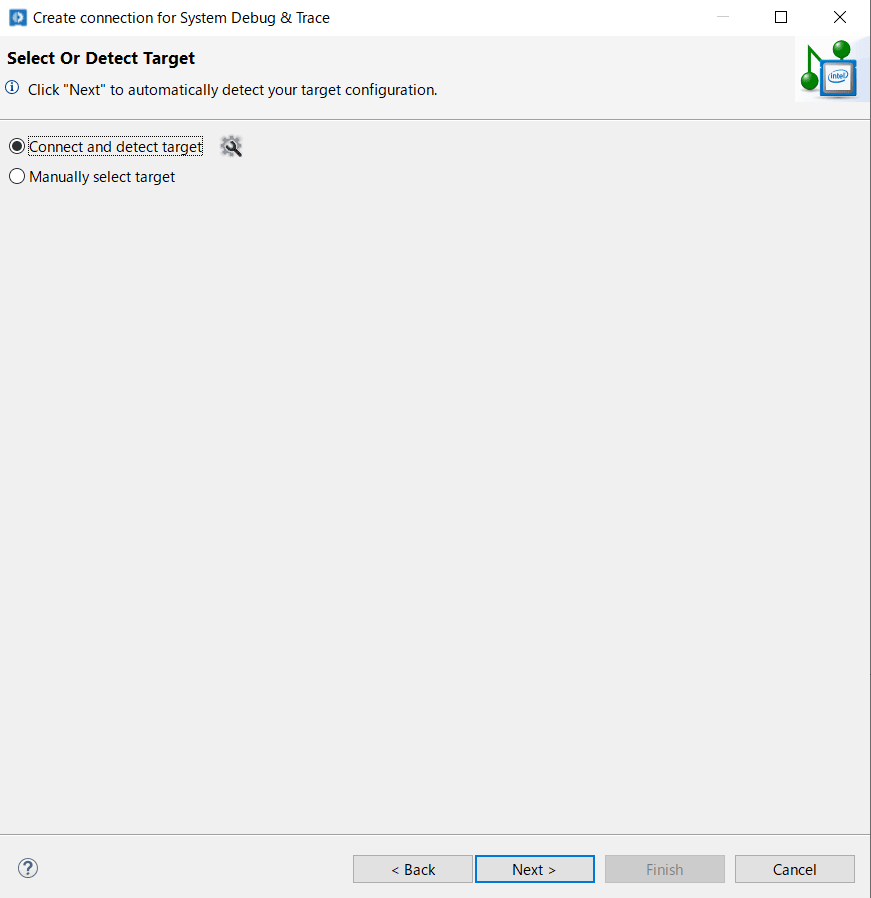
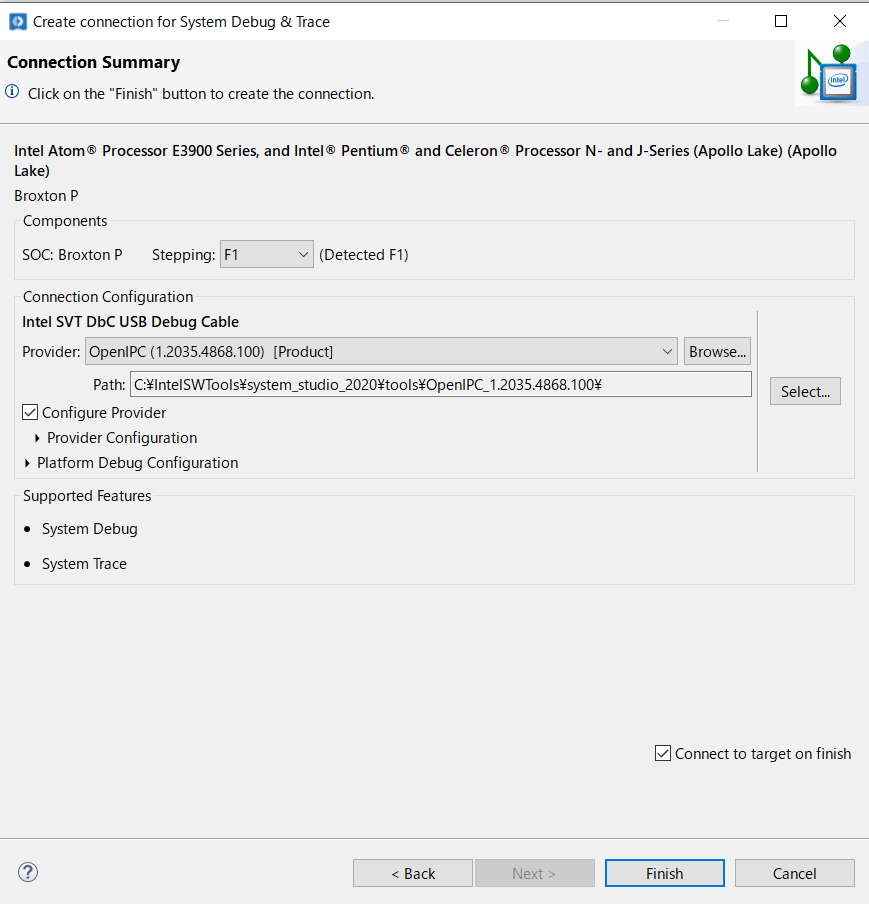
If the connection is established, you will see something like this.
If it didn't detect the target properly, you can "Manually Select Target" or try with different USB3.0 port on the target.
If you press Finish, you'll see the screen as follows.

Next, you have to setup Debug Configuration. Open the Debug Configuration as follows.

Select Intel System Debugger and click Apply without changing any configuration.


You will see a popup like this, so click Switch.

Eventually, you'll get this kind of screen.

Try suspending PC from System Debugger
Now if you click Suspend like below, and target freezes, then it's a success! Assembly will be displayed after you suspended.

If you want to debug boot phase, you can just reboot target.
Second time connecting Intel System Debugger
For the second time debugging, you can follow these.
- Power on UP2 board
- Run Target Indicator on host
- Connect debug cable
- Open ISS and use previous workspace
- Click
Verify Connected Targetto see if successfully connected - Click "Connect Button" to connect (tiny green icon)
- Click icon with a "bug" to run with the previous Debug Configuration
Acknowledgement
Again, great thanks to Satoshi Tanda for the support.

Top comments (0)