Folium is a great package for plotting data that contains latitude and longitude information. To do this it brings the power of leaflet, a JavaScript library for mobile friendly interactive maps, to Python. For this project I took a dataset of every publicly owned tree in New York City per a 2015 tree census to show how to clean such a dataset to plot a marker on a folium map for each row with a popup that provides a table of information for each row.
To begin, the first step is to import the data into a pandas DataFrame and inspect the first five rows.
# import pandas, load data
import pandas as pd
df_trees = pd.read_csv('new_york_tree_census_2015.csv.zip')

# print first 5 rows
df_trees.head()
[output]
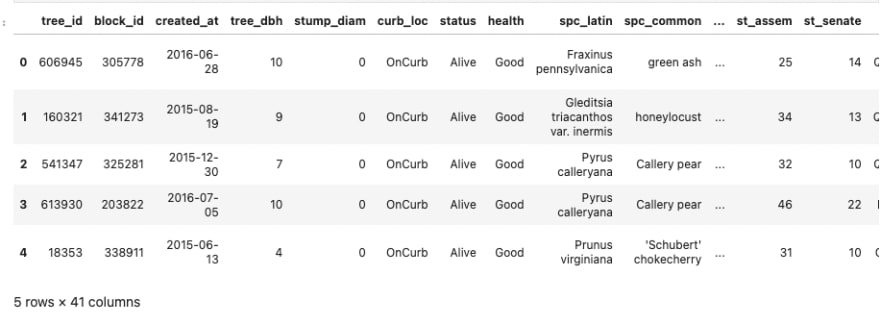
Using df.info to inspect the data shows that the dataset is over 600,000 rows long, with a mix of strings, integers and floating point data types. It also shows that there are many columns, so our next step will be to filter out some of the rows and reduce the amount of columns to only the ones we are interested in for our maps popup.
df_trees.info()
[output]

Using df.column can give us an easier way to visualize the columns we have.
df_trees.columns
[output]
Index(['tree_id', 'block_id', 'created_at', 'tree_dbh', 'stump_diam',
       'curb_loc', 'status', 'health', 'spc_latin', 'spc_common', 'steward',
       'guards', 'sidewalk', 'user_type', 'problems', 'root_stone',
       'root_grate', 'root_other', 'trunk_wire', 'trnk_light', 'trnk_other',
       'brch_light', 'brch_shoe', 'brch_other', 'address', 'zipcode',
       'zip_city', 'cb_num', 'borocode', 'boroname', 'cncldist', 'st_assem',
       'st_senate', 'nta', 'nta_name', 'boro_ct', 'state', 'latitude',
       'longitude', 'x_sp', 'y_sp'],
      dtype='object')
Looking at the 'status' column’s value_counts() method shows that there are over 30,000 trees that are either dead or only a stump. These may be worth mapping some other time, but for now we'll exclude them by making the DataFrame a slice of itself that only includes rows that list the tree as 'Alive'.
df_trees.status.value_counts()
[output]
Alive    652173
Stump     17654
Dead      13961
Name: status, dtype: int64
# slice DataFrame and inspect value counts
df_trees = df_trees[df_trees.status == 'Alive']
df_trees.status.value_counts()
[output]
Alive    652173
Name: status, dtype: int64
Now to reduce the columns in our DataFrame, we'll first make a list of all the columns we want to include and then slice the DataFrame with that list of columns. The columns keeped include the latitude and longitude, measurements of the tree, the address, zip code and health of the tree.
After that we make a list of cleaner column names and pass it to df.columns for better readability.
columns_of_interest = ['tree_id', 'tree_dbh', 'stump_diam','curb_loc', 'health', 'spc_latin', 'spc_common',
                       'steward', 'sidewalk', 'problems', 'address',
                       'zipcode', 'nta', 'latitude', 'longitude']
df_trees = df_trees[columns_of_interest]

new_column_names = ['tree_id', 'breast_height_diam', 'stump_diam','curb_loc', 'health', 'spc_latin', 'spc_common',
                    'num_stewards', 'sidewalk_damage', 'problems', 'address', 'zipcode', 'borough', 'latitude',
                    'longitude']
df_trees.columns = new_column_names
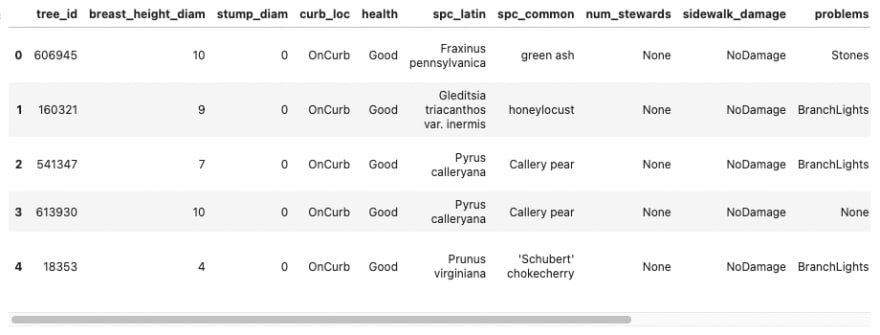
Printing out the first five rows confirms these changes took place. Now we can move on to cleaning the values inside the columns so that the popups on our map will present the information in a more readable way.
df_trees.head()
[output]
Looking at the 'curb_loc' column shows that the values are strings that capitalizes the first letter of every word, yet does not put spaces between words. To solve this we can use Series.apply() to pass a lambda function that uses a regular expression to substitute each value. The regular expression will place a space before each capitalized letter. Since this creates a leading space, adding .lstrip() will take that leading space out and then chaining .capitalize() will ensure only the first word of the string is upper case.
Checking .value_counts() confirms the formatting has been fixed.
import re

df_trees.curb_loc = df_trees.curb_loc.apply(lambda x: re.sub('([A-Z])', r' \1', x).lstrip().capitalize())
df_trees.curb_loc.value_counts()
[output]
On curb             626298
Offset from curb     25875
Name: curb_loc, dtype: int64
Next is the column that tells how many stewards take care of the tree. Since this uses 'or' to imply a range of stewards, we'll just replace the 'or' with a hyphen. We'll also change 'None' to '0'. This can be done by sending a mapping dictionary to .replace() where the keys are the value to change and the value is the value to substitute it with. inplace=True commits these changes and .value_counts() confirms they took place.
df_trees.num_stewards.replace({'None': '0', '1or2': '1-2' , '3or4': '3-4', '4orMore': '4+'}, inplace=True)
df_trees.num_stewards.value_counts()
[output]
0      487823
1-2    143557
3-4     19183
4+       1610
Name: num_stewards, dtype: int64
We'll use the same .replace() method for the 'sidewalk_damage' column. Since this lets us know if the sidewalk surrounding the tree is damaged or not, we'll change the values to a simple 'Yes' or 'No'.
df_trees.sidewalk_damage.replace({'NoDamage': 'No', 'Damage': 'Yes'}, inplace=True)
df_trees.sidewalk_damage.value_counts()
[output]
No     464978
Yes    187194
Name: sidewalk_damage, dtype: int64
Cleaning the 'problems' column will take a little more effort. Just like the 'curb_loc' column the values are strings without spaces between words where every word is capitalized. However, this column is different because some values are only one word long. For this I wrote a function that first checks how many words are in the string. If it only contains one word then the string is returned as is, while if the string contains more than one word the regular expression substitution from 'curb_loc' is applied and the leading space is stripped. Additionally, the string is joined onto a string containing a comma followed by a space to add commas plus the word 'and' is added before the final word.
def space_words(string):

    num_words = len(re.findall(r'[A-Z]',string))
    if num_words == 1:
        string = string

    if num_words > 1:
        string = re.sub('([A-Z])', r' \1', string).lstrip()
        string = ', '.join(string.split())
        string = string.split()
        string.insert(-1, 'and')
        string = ' '.join(string)

    return string
df_trees.problems.fillna('None', inplace=True)
df_trees.problems = df_trees.problems.apply(space_words)
df_trees.problems.value_counts()
[output]
None                                                                                   426329
Stones                                                                                  95673
Branch, and Lights                                                                      29452
Stones, Branch, and Lights                                                              17808
Root, and Other                                                                         11418
                                                                                        ...
Stones, Metal, Grates, Root, Other, Wires, Rope, Trunk, Other, Branch, and Lights           1
Stones, Root, Other, Branch, Lights, Sneakers, Branch, and Other                            1
Wires, Rope, Trunk, Other, Branch, Lights, and Sneakers                                     1
Stones, Root, Other, Wires, Rope, Trunk, Lights, Trunk, Other, Branch, and Lights           1
Stones, Wires, Rope, Trunk, Lights, Trunk, Other, Branch, Lights, Branch, and Other         1
Name: problems, Length: 232, dtype: int64
The original borough column mixed boroughs and neighborhoods, so it was dropped. However, the 'nta' column that is now called 'borough' contains strings with the first two characters being the abbreviation for the borough location. Reducing these values to simply the abbreviation is as simple as passing a lambda function to slice the first two characters out of each value through to the .apply() method.
df_trees.borough.apply(lambda x: x[:2]).value_counts()
[output]
QN    237947
BK    169771
SI    101443
BX     80348
MN     62664
Name: borough, dtype: int64
df_trees.info()
[output]
<class 'pandas.core.frame.DataFrame'>
Int64Index: 652173 entries, 0 to 683787
Data columns (total 15 columns):
 #   Column              Non-Null Count   Dtype
---  ------              --------------   -----
 0   tree_id             652173 non-null  int64
 1   breast_height_diam  652173 non-null  int64
 2   stump_diam          652173 non-null  int64
 3   curb_loc            652173 non-null  object
 4   health              652172 non-null  object
 5   spc_latin           652168 non-null  object
 6   spc_common          652168 non-null  object
 7   num_stewards        652173 non-null  object
 8   sidewalk_damage     652172 non-null  object
 9   problems            652173 non-null  object
 10  address             652173 non-null  object
 11  zipcode             652173 non-null  int64
 12  borough             652173 non-null  object
 13  latitude            652173 non-null  float64
 14  longitude           652173 non-null  float64
dtypes: float64(2), int64(4), object(9)
memory usage: 79.6+ MB
We are almost ready to start plotting our map, but first we will need to write out how to prepare our tree information for our popups. I'll first show how this is done one an example tree and then how to do this in a code to plot on our folium map.
Let's isolate the first tree and inspect it for the rows of interest for our popup.
test = df_trees.iloc[0]
test
[output]
tree_id                               606945
breast_height_diam                        10
stump_diam                                 0
curb_loc                             On curb
health                                  Good
spc_latin             Fraxinus pennsylvanica
spc_common                         green ash
num_stewards                               0
sidewalk_damage                           No
problems                              Stones
address                    76-046 164 STREET
zipcode                                11366
borough                                 QN37
latitude                             40.7243
longitude                           -73.8052
Name: 0, dtype: object
Next we'll make a dictionary for the tree with every key being the name of the information in a more readable format and every value the value for the column. Then we can pass this dictionaries values with .values() into a pandas DataFrame constructor with the dictionaries .keys() method chained on and passed into the index= argument. Lastly we can give the DataFrames values column a new title by passing a string in a list to the columns= argument.
tree_details = {'breast height diameter': test.breast_height_diam, 'stump diameter': test.stump_diam,
                'curb location': test.curb_loc, 'health': test.health, 'latin name': test.spc_latin,
                'common name': test.spc_common, 'number of stewards': test.num_stewards,
                'sidewalk damage': test.sidewalk_damage, 'problems': test.problems, 'address': test.address,
                'zipcode': test.zipcode, 'borough': test.borough}

test_df = pd.DataFrame(tree_details.values(), index=tree_details.keys(), columns=['Information'])

test_df

Now that we know how to make this for every tree, it's time to make our plot. Since our dataset contains over 600,000 trees, we'll only select a sample to plot. For this I decided to look at the list of species and pick one, then set our new map DataFrame to a slice of our cleaned original DataFrame for all trees of that kind
The Douglas fir has 85 listings so let's choose that one.
df_trees.spc_common.value_counts(ascending=True)[:15]
[output]
Virginia pine       10
Scots pine          25
Osage-orange        29
pitch pine          33
black pine          37
American larch      46
European alder      47
smoketree           58
Shantung maple      59
boxelder            64
Himalayan cedar     72
Ohio buckeye        75
southern red oak    83
quaking aspen       83
Douglas-fir         85
Name: spc_common, dtype: int64
map_df = df_trees[df_trees.spc_common == 'Douglas-fir']
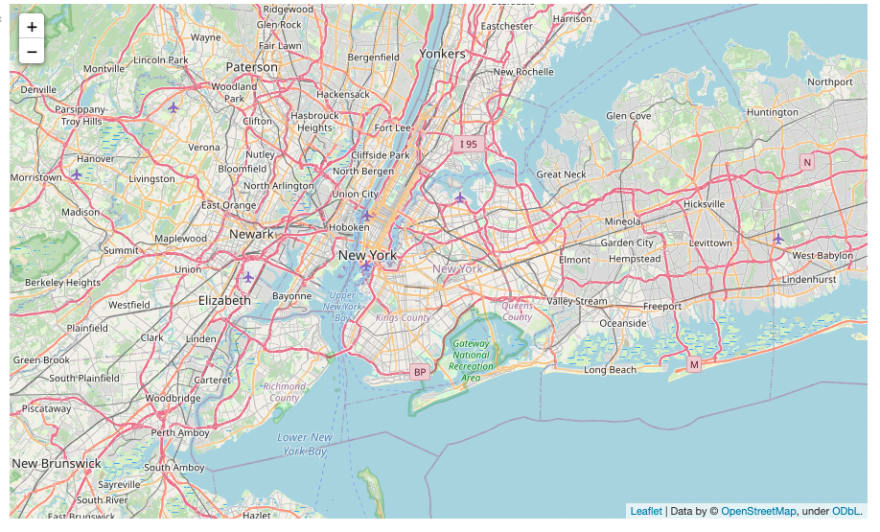
Now we can initialize our map. After importing folium, we can use it's Map class with a location passed. This will be the center of our map upon loading. For this we'll pass in a list with the first element being the mean latitude of our map_df and the second the mean longitude. A zoom of 10 is added to make the map more appealing upon loading, as well.
import folium

tree_map = folium.Map(location=[map_df.latitude.mean(), map_df.longitude.mean()], zoom_start=10)
tree_map
Now that we have our map object that prints a map, it's time to add our popups. To do this, we set up a loop to go over our map_df with iterrows(). Then, for every row/tree in our map_df we construct the tree's information DataFrame like we did before. Now, if we put this DataFrame into our popup it wouldn't be appealing at all. In order to format it for a popup we'll first convert the tree_details_df to html by chaining the .to_html() method. After that, we can insert that html object into folium's IFrame() class, which uses html to create a figure. This figure will then get put into folium's Popup() class which creates a popup instance to pass into the .Marker() with the latitude and longitude for the tree.
for index, tree_info in map_df.iterrows():

    tree_details = {'breast height diameter': tree_info.breast_height_diam, 'stump diameter': tree_info.stump_diam,
                    'curb location': tree_info.curb_loc, 'health': tree_info.health,
                    'latin name': tree_info.spc_latin, 'common name': tree_info.spc_common,
                    'number of stewards': tree_info.num_stewards, 'sidewalk damage': tree_info.sidewalk_damage,
                    'problems': tree_info.problems, 'address': tree_info.address, 'zipcode': tree_info.zipcode,
                    'borough': tree_info.borough}

    tree_details_df = pd.DataFrame(tree_details.values(), index=tree_details.keys(), columns=['Information'])

    html = tree_details_df.to_html()
    iframe = folium.IFrame(html=html, width=300, height=400)
    popup = folium.Popup(iframe)

    folium.Marker([tree_info['latitude'], tree_info['longitude']], popup=popup).add_to(tree_map)
tree_map


Top comments (1)
Not exactly what I was looking for but thank you for the post. I have studying binary trees to prepare for faang interviews.