This is the final part of a series detailing visualization, automation, deployment considerations, and pitfalls of Honeypots.
An extended version of this article and an according talk can be found at Virus Bulletin 2020.
After successful installation and customization, the deployed Honeypots start generating data. One of the main challenges at this stage is sighting the logs and finding interesting events. Humans aren't good at sighting big chunks of text; most people can grasp graphics much more quicky.
Hence, having dashboards is a good way of getting a quick overview of what's happening.
Sighting Data
The current state of our deployment is this: Logs over logs over logs.
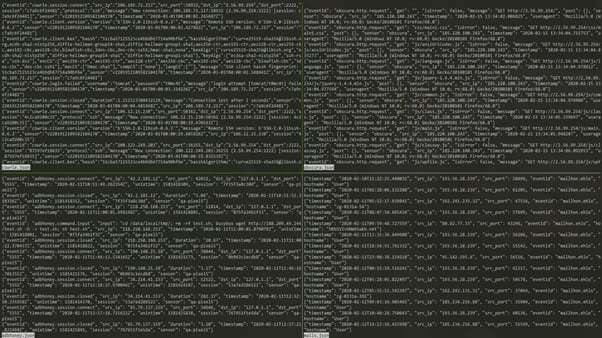
As logs are not tailored for human consumption, they are notoriously hard to read and check. This is where visualizations come into play. The author recommends ingesting logs into a central system like Elastic or Splunk that indexes the generated data.
Besides making all log data available for Dashboards, it also adds the advantage of making logs of all deployed Honeypots of your whole infrastructure available on a central system. This enables dashboard and report generation across the whole infrastructure and deeper insights.
For the remainder of this paper it is assumed that all logs are collected in a central Splunk instance, which is also used for the shown dashboards.
Some key metrics the authors find useful for daily work are:
- Connecting Source IP
- Number of different Source IPs in the last 60 minutes
- Top 10 connection counts by Source IP
- Username / Password pairs (failed & successful)
- SHA256 hashes of captured payloads
- List of executed commands (depending on Honeypot)
- Unique connection identifiers (i.e. SSH keys or client version strings)
Using Dashboards is no turnkey solution to better insights into produced log data. It lies still in the responsibility of the user to clean up data first before plotting it. In this context it is viable to consider lending common dataset preparation procedures from the area of Machine Learning. Some pointers can be the need for deduplication of events, i.e. multiple connections from the same source IP. Whilst in some scenarios this can be interesting, i.e. to find credential stuffing attacks, it can be counterproductive in others, like the absolute count of unique connections in a given timeframe.
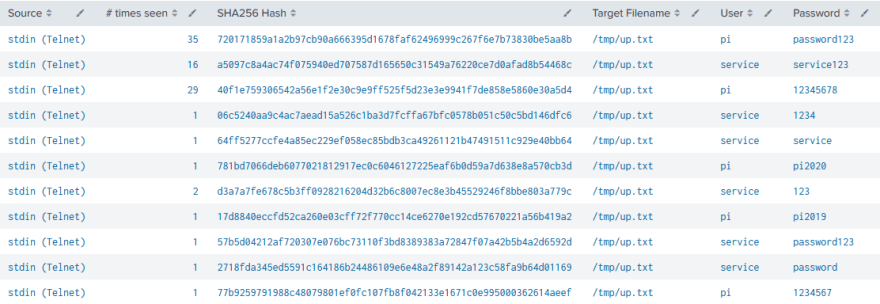
Above screenshot shows an example for noise in a dashboard. The file /tmp/up.txt is generated with different content but is always written to the same path. While itself part of an evasion technique, it also fills up dashboards that show the latest found payloads. This is where filtering can help to keep dashboards effective by lowering noise. After validating that the created file is indeed noise, it can be filtered by its path. Nevertheless, the contents of this file might change as well as its importance. With the filter in place, this change might be overlooked easily. Therefore, continuous data analysis and pattern recognition are required to keep a dashboard valuable and usable.
Automating Workflows
At this point the infrastructure consists of several running Honeypots that are producing data, which in turn is sent to a Splunk instance for indexing and dashboard generation.
Having a static dashboard with basic metrics is helpful for getting a grasp on the state of the infrastructure. If Honeypots are used in a more active scenario, i.e. for Threat Hunting, it is favourable to add common lookups and shortcuts to a dashboard to improve initial triage times. The proposed Splunk dashboard therefore contains contextual links to VirusTotal, Shodan and GreyNoise.

All encountered SHA256 hashes are direct links to VirusTotal searches, clickable IP addresses refer to Shodan and Autonomous System Numbers (ASNs) are used as a lookup for GreyNoise. These services should provide enough information to decide whether a detailed investigation could lead to interesting insights.
To further decrease the number of manual tasks, one can also consider the usage of Threat Intelligence Platforms like MISP which offer automated enrichment and analysis capabilities for submitted samples. Most Honeypots either already have API capabilities to upload Payloads to a target server or can be retrofitted to do so with little effort. In the showcased infrastructure, Cowrie is configured to query a MISP instance for the SHA256 hash of every encountered payload. If the payload is unknown, a new case is created in MISP and the payload is attached to it. If it was encountered before, a “sighting” event is added to the according case.
The advantage of platforms like MISP is the community aspect and the integrated enrichment capabilities that can give samples and payloads context, IOCs, and analyses of other members of a sharing group. In the presented architecture, this role is fulfilled by a tandem of MISP and TheHive. TheHive is another TIP that focuses more on external integrations and analyzers. In its current state, every encountered payload is uploaded to MISP, followed by an automated case creation in TheHive. This enables analysts to run analyzers with little additional overhead, as they do not need to create case files and upload samples by themselves.
This area of the proposed architecture can also be carried out by a Security Orchestration, Automated Response (SOAR) system to further automate responses and increase analytic capabilities.
Example Workflow
To illustrate the described system integration and workflows, we assume a file was uploaded to one of the Cowrie SSH Honeypots with the SHA256 hash of 69787a2a5d2e29e44ca372a6c6de09d52ae2ae46d4dda18bf0ee81c07e6e921d. As a first measure of interest, this file can be investigated in the Splunk dashboard:
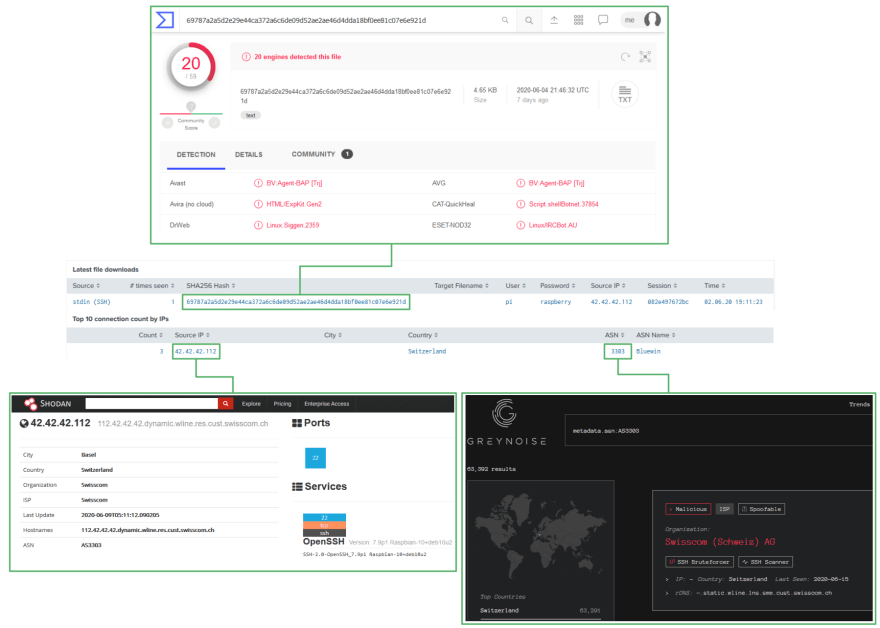
The dashboard already provides some valuable information on first sight. It can be derived that the payload was uploaded using the default credentials for a Raspberry Pi and the connecting address was located to Switzerland. By clicking on the hash or the IP address, either VirusTotal or Shodan can be checked for initial information. Last but not least, a click on the ASN leads to a GreyNoise query that lists all known systems in this ASN. This can add context to the IP as it gives pointers if the ASN is notoriously known for malicious traffic.
After this cursory glance it is decided to further investigate this sample. Based on the information provided by Shodan and VirusTotal, the current working hypothesis is that this is a Bash IRC bot distributed by a system with a Raspberry PI SSH version string.
As the payload was dropped on an integrated SSH honeypot, it has already been uploaded to a connected MISP instance where a new case has been created (or, in the case the payload already exists, a sighting has been added). The event already has the uploaded file attached as a malware sample including some additional metadata like common file hashes, the size in bytes and the entropy. From here on out, it is possible to make use of the MISP ecosystem to share and enrich encountered samples, for example through MISP Communities or MISP Community Feeds, as well as MISP plugins that integrate it with other products.

While the community aspect of MISP is its strong suit, there are other contenders regarding the effective use of integrations to 3rd party products. The tandem of The Hive and Cortex is an alternative that focuses more on said integrations. It consists of one or multiple Cortex instances that are responsible for running so called analyzers which are making use of several external services like IBM X-Force, RiskIQ Passivetotal, or HaveIbeenpwned. This is complemented by The Hive, which in turn offers case management, intel collection and templating capabilities.
Additionally, MISP and The Hive can work in two-way-synchronization mode, which unites the strengths of both platforms into an excellent solution for managing, tracking, and optimizing investigations. For the example at hand this means that an incoming Alert for the discovered IRC bot is awaiting its import as a case in The Hive.
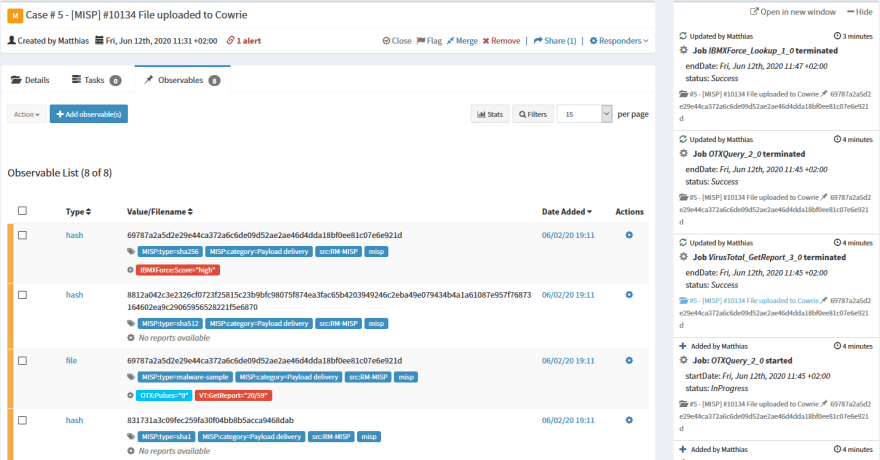
The payload and all its observables from MISP are imported and available for use in Cortex analyzers. As these are run, they generate additional observables and reports that can be added to the case at hand, as can be seen in the screenshot. The red tags attached to the hash and the file stem from critical results obtained by querying IBM X-Force and VirusTotal. All added metadata can also be synced back to MISP for integrity and sharing purposes.
At this point, an upload has been found and without opening the file itself, a preliminary examination was conducted which lead to the decision to further investigate the incident. The file was added to MISP and The Hive with minimal to no user interaction and made available to enrichment plugins and communities, therefore accelerating and improving the process of manual analysis and investigation.
Conclusions
Successfully deploying and integrating Honeypots and supporting software into an existing infrastructure can be a daunting task that requires a decent amount of planning. Nevertheless, the advantages are evident:
If integrated correctly, Honeypots enable faster alerting and a pre-emptive view into current attack strategies and automated attacks against publicly available infrastructure, whilst supporting integrations based on TIPs like MISP or The Hive speed up and improve the quality of Triaging and lower the amount of manual work done by Analysts. Combined with widespread log collection and well-designed Dashboards, this compliments better defensive strategies and measures against novel attacks.
Especially with the continuous popularity of container-based virtualization technologies, high-interaction Honeypots are expected to gain popularity and development traction. As it stands, this type of Honeypots is considerably harder to detect, which makes it prone for usage in internet-facing deployments. This is due to the fact that the architecture mitigates most of commonly used evasion techniques simply by being a fully custom system that behaves consistently and as close to a real system as possible.
Once deployed, Honeypots are a low maintenance asset that can bring high value to the table, be it as a pre-emptive alerting system for internal infrastructure or as a sensor for discovering ongoing campaigns and credential stuffing attacks, collecting value intelligence without manual interaction.
This concludes the series on honeypots. As a closing note, some resources can be recommended for getting started with custom deployments.
A good overview of common resources and projects is the repo awesome-honeypots which can be of great service if a specific service or system is needed.
First and foremost, an All-in-One solution that bundles multiple Honeypots with an Elastic stack, custom dashboards and a multitude of tools exist that is named T-Pot. This project is developed by Telekom Security and offers a quick start for the price of customization. As the project is rather complex and relies heavily on containers, customization of the bundled Honeypots is not as straightforward as it is in custom deployments. Nevertheless, it is an excellent starting point to get a feeling for deployments.
A step closer to fully customized Honeypots are frameworks that abstract shared functionality between specific implementations. Examples are DutchSecs honeytrap and Cymetrias honeycomb. Frameworks can speed up the development process of custom Honeypots but come with the price of predefined structure, as Frameworks rely heavily on conventions to work correctly.
With the release of this paper, the presented Splunk dashboards are made available for general use and can be found in this repository. This organization also holds repositories with the custom developed SMTP Honeypot mailhon as well as an IP Camera Honeypot, CameraObscura. Finally, the last project that is used in the demonstrated environment is an Android Debug Bridge Honeypot by the name of ADBHoney.
Last but not least, Honeynet has to be named as a central research organization that is dedicated to continued development of Honeypots as well as investigations into ongoing attacks.

Top comments (0)