Monitoring is a critical part of any software development life cycle (SLDC) and with the rising of microservices architecture and DevOps practices, it becomes more important and more complex. to understand how to monitor microservices we must take a step back to the monolith legacy app and how we used to monitor it.
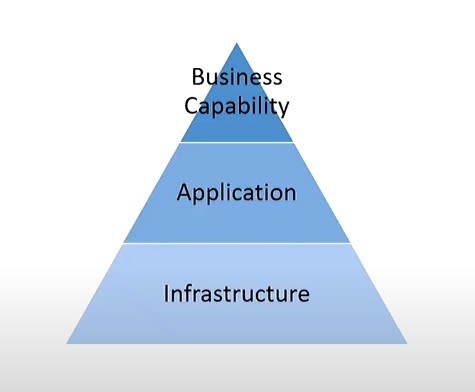
Three Pyramids Monitoring Philosophy
In a monolith environment we used to get some metrics which tell us how is our application status we usually start with infrastructure the physical hardware the host my application for example:
is my server up?
is my database up?
can web server talk to the database?
Then we move to another step to inquire about our application it self and ask a different question:
is my application process running?
Then we move another level up we monitor the functionality and business capability and that lead to ask different question like: can user place an order?
The past 3 level infrastructure, application, and business capability is called Monitoring Areas
let’s move to different perspective and let’s change the questions a little
let’s check for application health by asking
is my server up ?
and check for application performance by asking
is there is high CPU?
and check about capacity by asking
do i have enough disk space?
by answering these 3 question i get another metrics about health, performance and capacity of the system and this is called Monitoring Concerns.
and there is many to many relation between Monitoring Areas and Monitoring Concerns and it depends of the combination of a question we ask for example:
is my server up ? is there is high CPU? do i have enough disk space?
here i targeting health, performance and capacity of my infrastructure
and if i ask:
is my application generating exceptions? how quickly system process messages? can I handle month end batch job?
here I targeting health, performance and capacity of application layer and if i change the questions again and ask:
can users access checkout cart? are we meeting SLAs? what is the impact of adding another customer?
we targeting the health, performance and capacity of business capability layer.
there is also third permit i want to introduce this the Interaction Types which show how i monitor the system
- passive monitoring: where you access the system dashboard and see current and past values
- Reactive monitoring : where monitoring system alert me when something happens like system send email when queue length is reach 50
- Proactive Monitoring: where monitoring system take action automatically to repair system like when the queue length reach 50 auto scale up another instance to solve the problem
so again it’s many to many relationship between the 3 monitoring pyramids so if I ask the first 3 question in the beginning of article:
is my server up?
is my database up?
can web server talk to the database?
then I monitor about infrastructure health at the point of time and it’s of-course passive monitoring.
so whenever you decide the metric you want to monitor keep in your mind what’s the Area you want to monitor what concern you want to get information about and interaction
these 3 pyramids are a way of thinking about what you are monitoring and interrogate whether it’s monolith system or distributed system that’s useful for you.
What’s Happens when we deal with distributed system?
the problem with distributed system is w start with a single point and we carve off pieces of functionality we communicate with messaging protocols and we will spin up a few others areas we got more than server to watch each of them has it’s own database that’s a lot more infrastructure to worry about on top of that the dynamic nature of microservices what if i scale out one of my services you got 4 instance of it all consuming one input queue or may be also distributed queue does it make sense to monitor queue length. it’s little tricky may be yes you should monitor it may be no. and it get more complicated as you increase the dynamic nature of systems you can run and it will be a lot of information that we can collect and it doesn’t make sense we look at every thing.
Let’s take a look at component of distributed system and see how we can monitor it.
Queue Length is the simplest metric every broker technology or queue technology have some method to provide queue length so what this metric tells us
- Queue length is an indicator of work outstanding
- High queue length doesn’t necessarily mean there is a problem so if it’s high but stable or decreasing or there is some spikes that’s can be good but if it’s increasing per the time it is problem
so for our pyramids we monitoring for infrastructure performance but this not give us a clear insight so let’s look for another important metric here.
Message Processing Time so we should get the time from message be in the front of queue until it finish her task whatever it was upload file via FTP or perform some query on database and finish it and remove the message from queue
- Processing time is the time taken to successfully process the message
- Processing time doesn’t include error handling time
- it’s dependent on queue waiting time finish the process successfully here is important because if error thrown during processing that’s mean shouldn’t be removed it can sent to another pod to handle it again if it’s stable or decreasing or there is some spikes that’s can be good but if it’s increasing per the time it is problem
this lead us to a new concept it’s the Critical Time. it’s time counter from raising our message to reach at the front of the queue the processed and then time stop so what if there is network latency or even the instance that will process message is crashed and restarted and there was many retries to deliver message does critical time stop no it’s actually still counting. from that we can get a formula that describe Critical Time.
Critical Time = Time In Queue + Processing Time + Retries Time + Network Latency Time
and very similar to other metrics if it’s stable or decreasing or there is some spikes that’s can be good but if it’s increasing per the time it is problem
Let’s Put All Together
Each of these metrics represent a part of the puzzle.
Looking at them from endpoint’s perspective not per message.
Look at them together gives great insight into your system.
Let’s show some cases and analysis them
Case 1:
what we have here? stable critical time a spiky processing time and stable queue length over time. what this tells us about system?
system kind of keeping up with all the messages that are coming in also we are processing them because the queue length isn’t increasing but why processing time is not stable? it could be a number of things cause that jumping around may be there is contention of resources or may there is locking mechanism when handler receive the message it lock until it update some resource it could be also some messages which handle by that end point go quickly and others don’t and you can use that information to isolate the slow ones into their endpoint and scale the new endpoint out independently.
Case 2:
here we have high critical time, high processing time and and kinda medium queue length but all is stable . what this tells us?
the system is keeping up with the capacity but we are at the limit so as soon as any traffic spike that queue length is sky rocket and the critical time will be as well. so this may be a good indication to scale out those resources.
Case 3:
here we have high critical time , low processing time and low queue length. what is this means?
may be there is problem in network because if you remember the equation of critical time include the network latency time also may be a lot of retries t in processing the message we measure processing time for successfully processed message only so the problem connectivity or retries.
so if monitoring distributed system how you there’s communication breakdowns?
actually if you monitoring distributed system the easy way i to do health check and if your services replies with 200 status that’s mean it’s up but communication into distributed system usually done using brokers and when instance send message to the broker it doesn’t know if this message reach their destination or not the easiest option here is when the message reach it’s destination a read receipt is send back. is this good idea ?!! it’s not why ? we create turned our decoupled system into req/res system :( and we got double the message sent over the system.
the solution here is peer-to-peer connectivity tells us if an endpoint is actually processing the message from another.
What’s the tools to use?
we have a bunch of tools can collect metrics for us splunk , kibana, D3 and Grafana all are suitable for monitoring.
How we will collect all this information we sent?
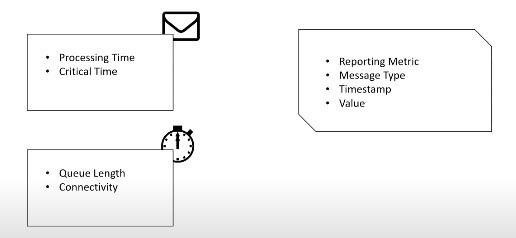
if we talk about critical time or processing time it will be per message metrics when we send a message that message will have it’s processing time and critical time associated with it.
queue length and connectivity you might do checks periodically every minuet or every 5 minuets
How we store this?
A good schema to store this is: metrics type, message type, timestamp, and the value. But this is a very expensive way to store your metrics there are different techniques to do this but it’s out of this lecture scope.
How we display metrics?
We can use ELK stack to do this it will be suitable use case.
Conclusion:
Monitoring distributed systems is not easy process and direct proportional with how much dynamic is the system but with understanding the philosophy of monitoring and by choosing the right metrics that help to analysis system and keep it healthy :)


Top comments (0)