On my team, we've recently started making more diagrams before and after we write code. When we’re trying to decide a path forward, diagrams are a great way to visualize the flow of information through a system. Diagrams are also a wonderful artifact and deliverable for stakeholders and future developers. However, none of us are completely fluent in Unified Modeling Language (UML), the industry-standard way to make diagrams, and that’s ok!
Time is expensive. Learning all the subtleties of UML would take a lot of time and require your audience to do the same. Boxes and lines are all you need to create informative diagrams that everyone can understand. So let’s be frugal with our time, draw boxes and lines, and get the most bang for our buck.
What is UML?
UML stands for Unified Modeling Language and was created to define a standard visual vocabulary for specifying, modeling, and documenting systems. Its most common use case is for modeling software systems, but it can be applied to any system such as manufacturing or business processes.
UML defines 13 standard diagram types. For each type, it defines how to draw shapes and lines, how to label them, what types of connectors to use, and various other visual indicators to model structure, behavior, and interaction of a system. It outlines things such as when to use a rectangle with rounded edges vs a regular rectangle or a solid line vs a dashed line and what those differences indicate in the context of your diagram.
Unfortunately, the language specification is incredibly dense and hard to understand. From the official website, “[The UML specification is] also highly technical, terse, and very difficult for beginners to understand.” But at its core, UML is just boxes and lines.
Why UML?
If UML is so hard to learn and understand, why are we even talking about it? Having a shared visual vocabulary is incredibly valuable. I would argue that 95% of the time, we don’t need the nuance of the entire UML spec. 95% of the time, boxes and lines are the only tools we need to quickly and easily convey an idea. And by keeping things that simple, your audience is usually able to intuit your meaning.
I think a high-level understanding of just a few of the standard diagram types and when to use them is helpful. My rule of thumb is to have a preferred diagram type you can reach for in each of the 3 categories: structure, behavior, and interaction (interaction is often included as a subtype of behavior). I’ll outline which 3 I think are the most useful but you may choose a different set of 3 depending on the type of systems you work with and software development you do.
Structure diagram
When I want to model the structure of a system or part of a system, I like to reach for a class diagram. A class diagram outlines the classes, their attributes and operations, and the relationships between instances of the classes. I often cut corners with this diagram by not worrying about labeling the access modifiers on the attributes and operations. I even leave the attributes and operations out a lot of the time! 😱
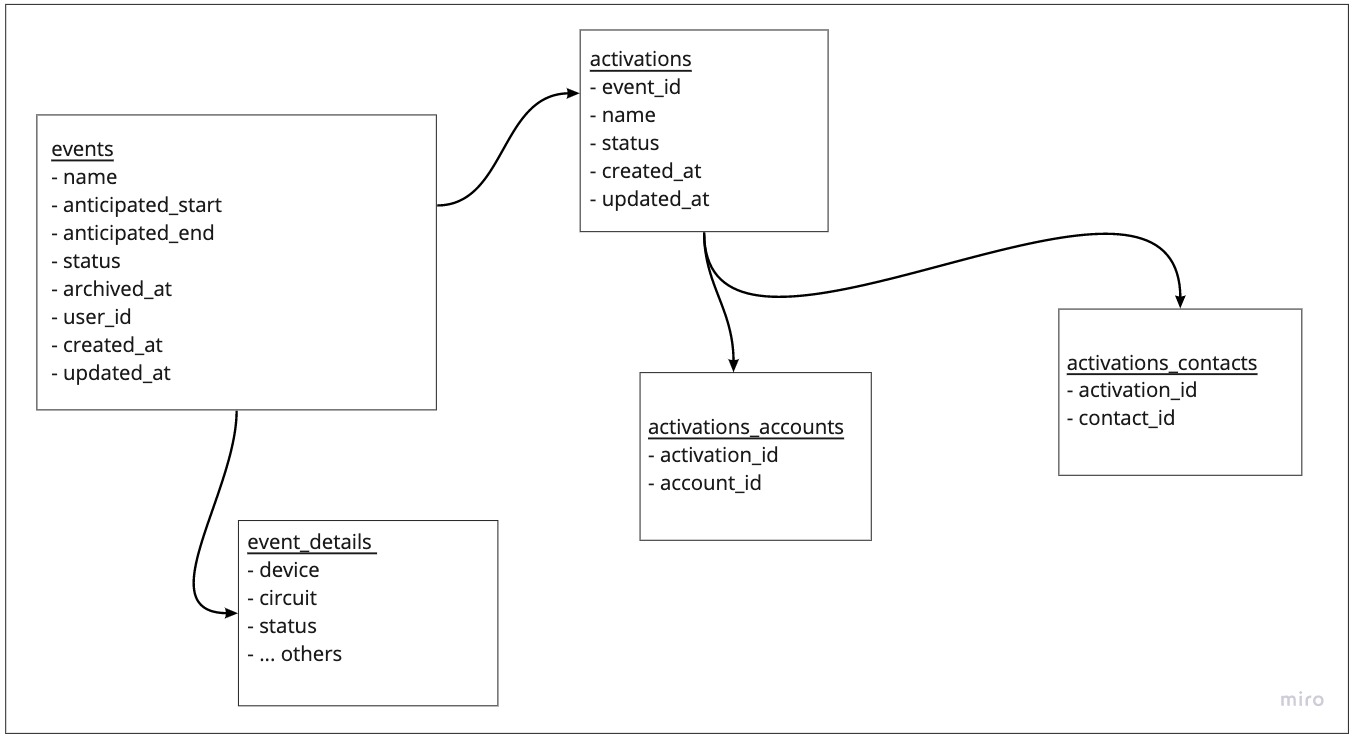
The bit that I find most valuable is modeling the relationships between classes. I find class diagrams especially helpful to model composition and inheritance within more complex parts of an application. Being able to visually see those relationships provides crucial context. And don’t worry if it's hard to remember what type of arrow and line to use in a class diagram, I almost always mess it up. Modeling that there is a relationship is the important part, what the relationship is can be inferred or labeled if the arrow isn’t correct.
If you want to learn about class diagrams and how to make them, I like LucidChart’s tutorial or Visual Paradigm's guide.
Behavior diagram
When I want to model the behavior of a part of a system, I like the simplicity of activity diagrams. An activity diagram is a developer’s flow chart. It’s great for modeling step-by-step what happens in a system and visualizing the logic in your code. The nice part about an activity diagram is that you can make it as high-level or granular as you want. You could focus on the major milestones for a user request, from the frontend to the server to the database or you could focus on the steps of a single algorithm in one file in your code.
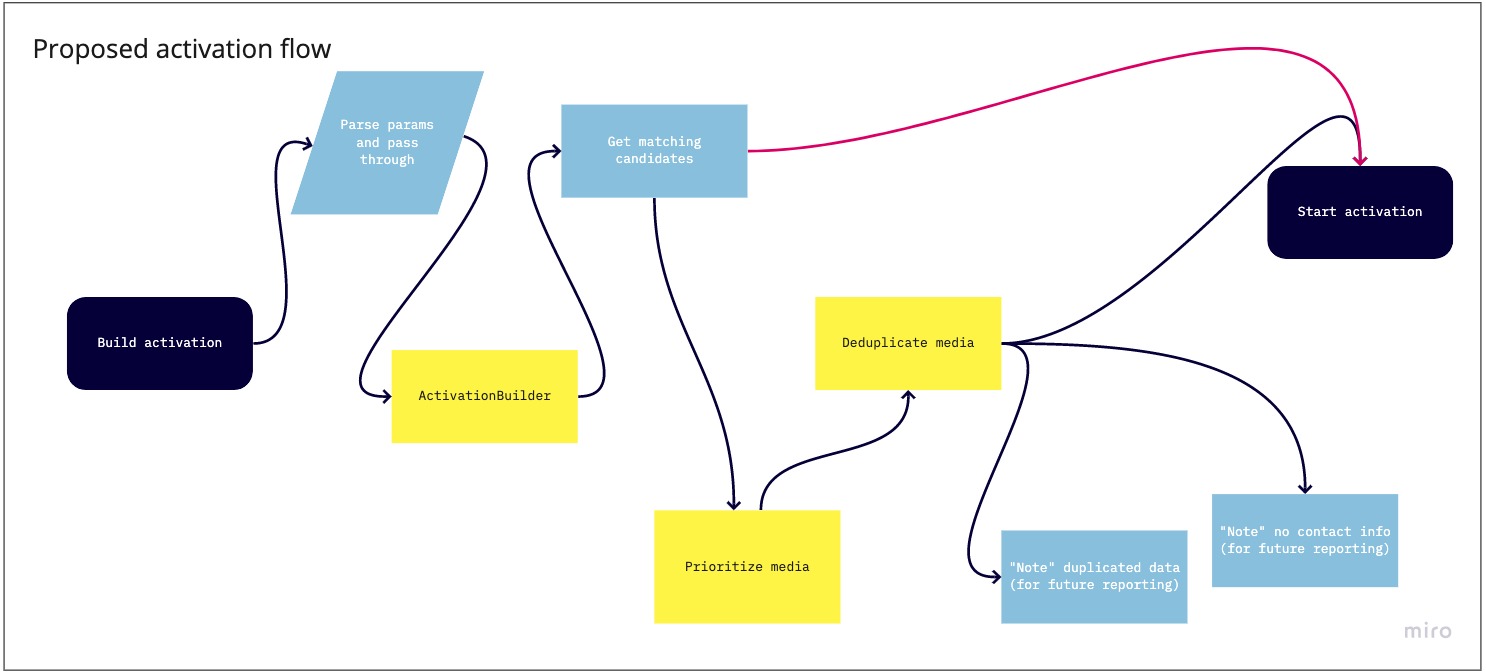
Like class diagrams, I don’t think it’s incredibly important to use a diamond to represent a decision or use the correct start and end symbols. Your audience is smart and they can understand your meaning if you focus on visually modeling the flow with just standard boxes and arrows.
Check out LucidChart’s tutorial or Visual Paradigm's guide to dig deeper into activity diagrams.
Interaction diagram
The last diagram that I always have on hand is a sequence diagram. When I want to show how data moves through a system—passing from one object to another and how the return values are interacted with by other objects—I choose a sequence diagram. Of the 3 I’ve shared in this post, this one might look the most complicated but it's extremely helpful for showing a process modeled over time. In a sequence diagram, you create a lifeline for each object in your system to show its responsibilities while it’s in use. When you read a sequence diagram, you are reading it both horizontally and vertically. Horizontally documents the control flow and vertically documents the passage of time.
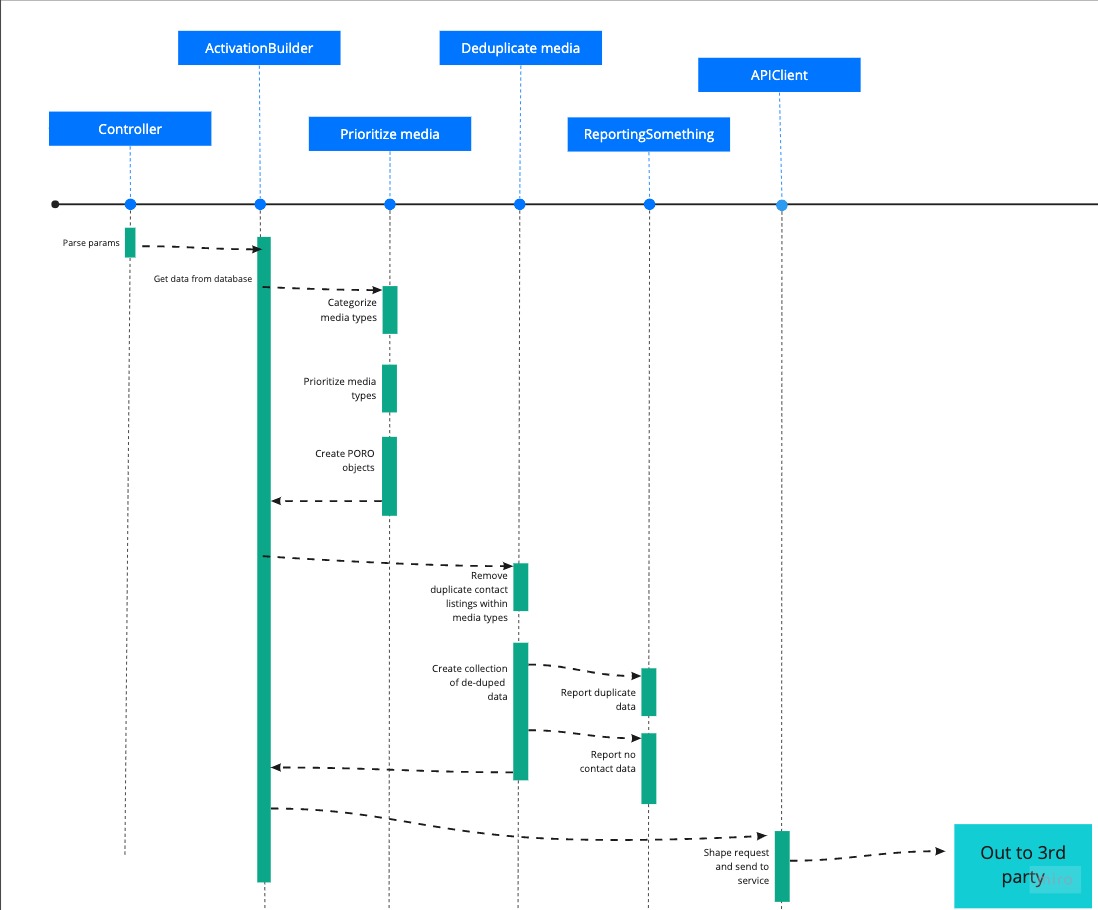
As before, I don’t think it’s especially important to get the correct arrow to show whether an operation is synchronous or asynchronous. It’s much more important to document that an operation happens and in what order rather than get the little details correct.
To learn more about sequence diagrams and how to create them, here’s LucidChart’s tutorial and Visual Paradigm’s guide.
Benefits of diagrams
Whether you are interested in learning more about UML or never want to touch it again (both valid!), I hope that you’ll still try to find opportunities to visualize your code. Whatever combination of boxes and lines you draw is the right combination if it helps you understand your system and think deeper about what you’re building.
Before you start writing code, try sitting down to visually document what’s currently there and what you want it to look like when you’re done. This is especially helpful if the code you’re working with is a bit of a spaghetti mess. You can map out a variety of possible solutions and identify the pros and cons of each approach.
After you’ve finished coding a small chunk of work, try documenting the system, what decisions were made, and visually show the roadmap to get to your desired end state. If you decide to join the circus someday, the diagrams you made can continue to shepherd your team and the project forward 🎪
Drawing diagrams and developing your visual vocabulary can do wonders for your software development skills. It can grow your logical thinking skills and your ability to see multiple solutions to a single problem. And it can help you organize your thoughts to make the best decision with the information available. UML is complicated and it would take a lot of time to learn and memorize all the tiny details of when to use a closed arrow vs an open arrow. Be frugal with your time, use boxes and lines to get the most return on your investment.

Top comments (1)
Some comments may only be visible to logged-in visitors. Sign in to view all comments.