
The Story
We would like to install the monitoring tool Prometheus and Grafana with helm 3 on our local machine/VM running a Kubernetes cluster.
In this post, we will go through the procedure of deploying Prometheus and Grafana in a Kubernetes Cluster.
TL;DR
The How
Prerequisites
For this application, we need a Kubernetes cluster running locally and to interface with it via kubectl. The list below shows some of the tools that we'll need to use for getting our environment set up properly.
- We will use Vagrant
- With VirtualBox
- To run K3s and,
- Interface with it via
kubectl
The Walk-through
Configuration
All Vagrant configuration is shown below. Vagrant leverages VirtualBox which loads an openSUSE OS and automatically installs OS dependencies, K3s and helm. Some useful vagrant commands can be found in this cheatsheet.
Running cat Vagrantfile, results in the config:
# -*- mode: ruby -*-
# vi: set ft=ruby :
default_box = "opensuse/Leap-15.2.x86_64"
box_version = "15.2.31.309"
# The "2" in `Vagrant.configure` configures the configuration version (we
# support older styles for backwards compatibility). Please don't change it # # unless you know what you're doing.
Vagrant.configure("2") do |config|
  # The most common configuration options are documented and commented on below.
  # For a complete reference, please see the online documentation at
  # https://docs.vagrantup.com.

  # Every Vagrant development environment requires a box. You can search for
  # boxes at https://vagrantcloud.com/search.

  config.vm.define "master" do |master|
    master.vm.box = default_box
    master.vm.box_version = box_version
    master.vm.hostname = "master"
    master.vm.network 'private_network', ip: "192.168.33.10",  virtualbox__intnet: true
    master.vm.network "forwarded_port", guest: 22, host: 2222, id: "ssh", disabled: true
    master.vm.network "forwarded_port", guest: 22, host: 2000 # Master Node SSH
    master.vm.network "forwarded_port", guest: 6443, host: 6443 # API Access
    for p in 30000..30100 # expose NodePort IP's
      master.vm.network "forwarded_port", guest: p, host: p, protocol: "tcp"
    end
    master.vm.provider "virtualbox" do |vb|
      # v.memory = "3072"
      vb.memory = "2048"
      vb.name = "k3s"
    end

    master.vm.provision "shell", inline: <<-SHELL
      echo "******** Installing dependencies ********"
      sudo zypper refresh
      sudo zypper --non-interactive install bzip2
      sudo zypper --non-interactive install etcd
      sudo zypper --non-interactive install lsof

      echo "******** Begin installing k3s ********"
      curl -sfL https://get.k3s.io | INSTALL_K3S_VERSION=v1.19.2+k3s1 K3S_KUBECONFIG_MODE="644" sh -
      echo "******** End installing k3s ********"

      echo "******** Begin installing helm ********"
      curl https://raw.githubusercontent.com/helm/helm/master/scripts/get-helm-3 | bash
      echo "******** End installing helm ********"
    SHELL
  end
end
Running the following command will start up the virtual machine and install the relevant dependencies: vagrant up
Install Prometheus with Helm 3
Let's
sshinto our freshly baked VM:vagrant sshLet's create a namespace
monitoringfor bundling all monitoring tools:kubectl create namespace monitoringInstall
Prometheususinghelm 3on themonitoringnamespace
| Helm is a popular package manager for Kubernetes (thinkaptforUbuntuorpipforPython). It uses a templating language to make the managing of multiple Kubernetes items in a single application easier to package, install, and update.
helm repo add prometheus-community https://prometheus-community.github.io/helm-charts
helm repo add stable https://charts.helm.sh/stable
helm repo update
# Use k3s config file, normally this would be in `~/.kube/config`
helm install prometheus prometheus-community/kube-prometheus-stack --namespace monitoring --kubeconfig /etc/rancher/k3s/k3s.yaml
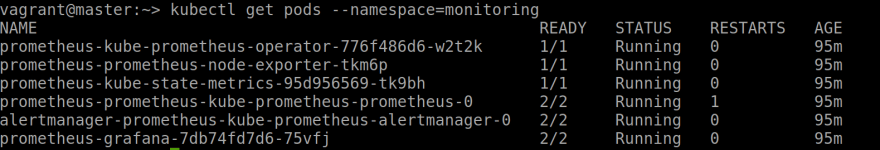
If the installation was successful you should be able to see 6 running pods:
- Alert manager: This allows us to create alerts with Prometheus
- Operator: This is the application itself
- Exporter: This is responsible for getting the logs from the nodes
- Grafana and other metrics tools
kubectl get pods --namespace=monitoring
and,
helm ls --namespace monitoring

Once everything is up and running we need to access Grafana.
It is highly advisable to use some kind of ingress to expose the services to the world, an example would be to use NGINX.
But for testing purposes, we can either use;
-
kubectl port-forwardor, - Expose pods with NodePort service.
These are simple ways of forwarding a Kubernetes service's port to a local port on your machine.
NOTE: This is something you would never do in production but would regularly do in testing.
Port-forwarding with kubectl port-forward
kubectl port-forward prometheus-prometheus-kube-prometheus-prometheus-0 --address 0.0.0.0 3000:80 -n monitoring
In my case, this was never successful and I had to opt for the second option.
Port-forwarding with NodePort service
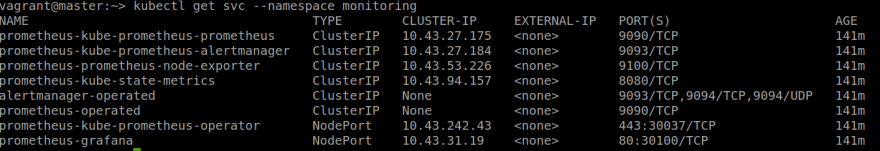
Retrieve all services running on the monitoring namespace
vagrant@master:~> kubectl get svc --namespace monitoring

NAME                                      TYPE        CLUSTER-IP     EXTERNAL-IP   PORT(S)                      AGE
prometheus-kube-prometheus-prometheus     ClusterIP   10.43.27.175   <none>        9090/TCP                     40m
prometheus-kube-prometheus-alertmanager   ClusterIP   10.43.27.184   <none>        9093/TCP                     40m
prometheus-prometheus-node-exporter       ClusterIP   10.43.53.226   <none>        9100/TCP                     40m
prometheus-kube-state-metrics             ClusterIP   10.43.94.157   <none>        8080/TCP                     40m
alertmanager-operated                     ClusterIP   None           <none>        9093/TCP,9094/TCP,9094/UDP   40m
prometheus-operated                       ClusterIP   None           <none>        9090/TCP                     40m
prometheus-kube-prometheus-operator       ClusterIP    10.43.242.43   <none>        443/TCP                40m
prometheus-grafana                        ClusterIP    10.43.31.19    <none>        80/TCP                 40m
You will need to make some modification to the prometheus-grafana YAML config such that you can access Grafana from your local machine.
Run kubectl edit svc --namespace monitoring prometheus-grafana and make the following changes:
-
type: ClusterIPwithtype: NodePort, and - Change
nodePortand choose from range30000 - 30100as defined in theVagrantfile.
Do the same for prometheus-operator:
kubectl edit svc --namespace monitoring prometheus-kube-prometheus-operator
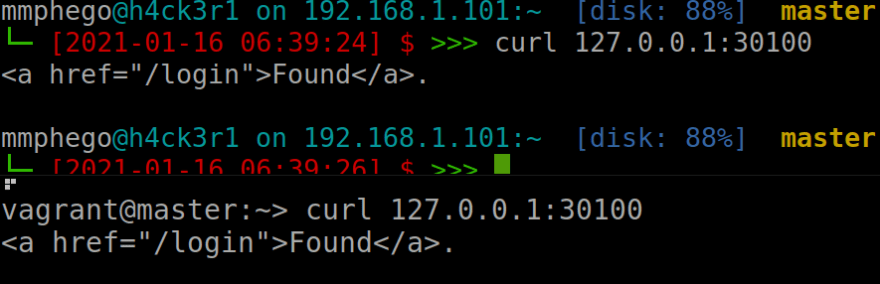
Verify that services were updated, and we should see service type as NodePort and exposed/forwarded ports.
Alternatively, you can patch the config. Read more here
Verify that you can access the localhost through port 30100
Also, check out more details on best practices when accessing Applications in a Cluster.
Access Grafana
If the installation was successful we should be able to access Grafana from our local system. Thanks to port-forwarding.
Note: When installing via the Prometheus Helm chart, the default Grafana admin password is actually prom-operator

Troubleshooting
Vagrant cannot forward the specified ports on this VM
Vagrant cannot forward the specified ports on this VM, since they
would collide with another VirtualBox virtual machine's forwarded
ports! The forwarded port to 4567 is already in use on the host
machine.

To fix this, modify your current projects Vagrantfile to use another
port. For example, where '1234' would be replaced by a unique host port:

  config.vm.forward_port 80, 1234
As the message says, the port collides with another port on the host box. I would simply change the port to some other value on the host machine or let Vagrant auto-correct itself if it encounters any collisions.
In the Vagrantfile, append , auto_corrent: true and the end of master.vm.network "forwarded_port", guest: 6443, host: 6443
Read more here
Communicate with the K3s cluster through local kubectl
After vagrant up is done, you will SSH into the Vagrant environment and retrieve the Kubernetes config file used by kubectl. We want to copy the contents of this file into our local environment so that kubectl knows how to communicate with the K3s cluster.
vagrant ssh
Print out the contents of the file.
sudo cat /etc/rancher/k3s/k3s.yaml
On a separate terminal, create the file (or replace it if it already exists)
vim ~/.kube/config
and paste the contents of the k3s.yaml output here.
Afterwards, you can test that kubectl works by running kubectl describe services. It should not return any errors.
Connection refused
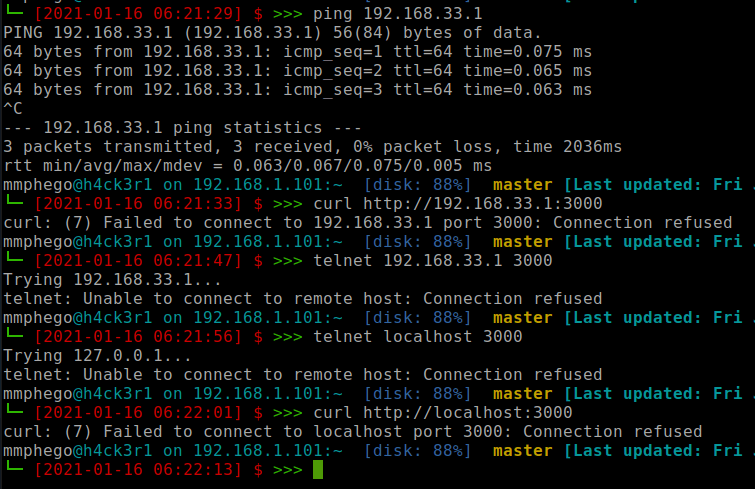
I encountered a few issues trying to access Grafana through port-forwarding, This was related to the way I configured port-forwarding on vagrant. A walk-around is to either;
- Expand the number of
forwarded_portonVagrantfileor - Use existing
forwarded_port's available.
Lastly, check all listening ports, run netstat -tulpn:
vagrant@master:~> sudo netstat -tulpn

Active Internet connections (only servers)
Proto Recv-Q Send-Q Local Address           Foreign Address         State       PID/Program name
tcp        0      0 127.0.0.1:10248         0.0.0.0:*               LISTEN      5596/k3s server
tcp        0      0 127.0.0.1:10249         0.0.0.0:*               LISTEN      5596/k3s server
tcp        0      0 0.0.0.0:30442           0.0.0.0:*               LISTEN      5596/k3s server
tcp        0      0 127.0.0.1:10251         0.0.0.0:*               LISTEN      5596/k3s server
tcp        0      0 127.0.0.1:10252         0.0.0.0:*               LISTEN      5596/k3s server
tcp        0      0 127.0.0.1:6444          0.0.0.0:*               LISTEN      5596/k3s server
tcp        0      0 127.0.0.1:10256         0.0.0.0:*               LISTEN      5596/k3s server
tcp        0      0 0.0.0.0:30100           0.0.0.0:*               LISTEN      5596/k3s server
tcp        0      0 0.0.0.0:30037           0.0.0.0:*               LISTEN      5596/k3s server
tcp        0      0 0.0.0.0:22              0.0.0.0:*               LISTEN      1015/sshd
tcp        0      0 127.0.0.1:631           0.0.0.0:*               LISTEN      905/cupsd
tcp        0      0 127.0.0.1:25            0.0.0.0:*               LISTEN      1002/master
tcp        0      0 127.0.0.1:10010         0.0.0.0:*               LISTEN      5632/containerd
tcp        0      0 0.0.0.0:32030           0.0.0.0:*               LISTEN      5596/k3s server
tcp        0      0 :::10250                :::*                    LISTEN      5596/k3s server
tcp        0      0 :::6443                 :::*                    LISTEN      5596/k3s server
tcp        0      0 :::9100                 :::*                    LISTEN      8779/node_exporter
tcp        0      0 :::22                   :::*                    LISTEN      1015/sshd
udp        0      0 0.0.0.0:68              0.0.0.0:*                           658/wickedd-dhcp4
udp        0      0 0.0.0.0:8472            0.0.0.0:*                           -
Error: Kubernetes cluster unreachable with helm 3
vagrant@master:~> helm list
Error: Kubernetes cluster unreachable: Get "http://localhost:8080/version?timeout=32s": dial tcp 127.0.0.1:8080: connect: connection refused
Let helm use the same config kubectl uses, this fixes it.
vagrant@master:~> echo "export KUBECONFIG=/etc/rancher/k3s/k3s.yaml" >> ~/.bashrc
or
vagrant@master:~> kubectl config view --raw >~/.kube/config

Top comments (0)