
If you ever looked at your CloudWatch logs and felt that you could not get a grasp of how your Lambdas have been running, then join the club. I wanted a simple way to visualize my batch jobs and track them from start to finish to find the slow-running ones. So, I built this real-time monitoring app to do the job.
The entire stack is easily deployable with the AWS CDK and should be pretty simple to adapt into any pre-existing lambda functions. If you're interested in knowing how you can track yours, read till the end and I will show you how :)
In this blog post, I will show you how I built this real-time monitoring solution, what I learned along the way, and then how you can do it yourself.
This is what the finished project looks like:
This is what we will cover in this blog post:
- Architecture Overview
- How to setup a WebSocket API for real-time monitoring
- Understand EventBridge and how we use it to communicate between services
- How to monitor your own Lambdas
- Conclusion
1. Architecture Overview
To achieve our real-time monitoring we will be using services like Websocket API Gateway, EventBridge, Lambda Functions, DynamoDB, and S3 for hosting our web UI. Here is the overview:
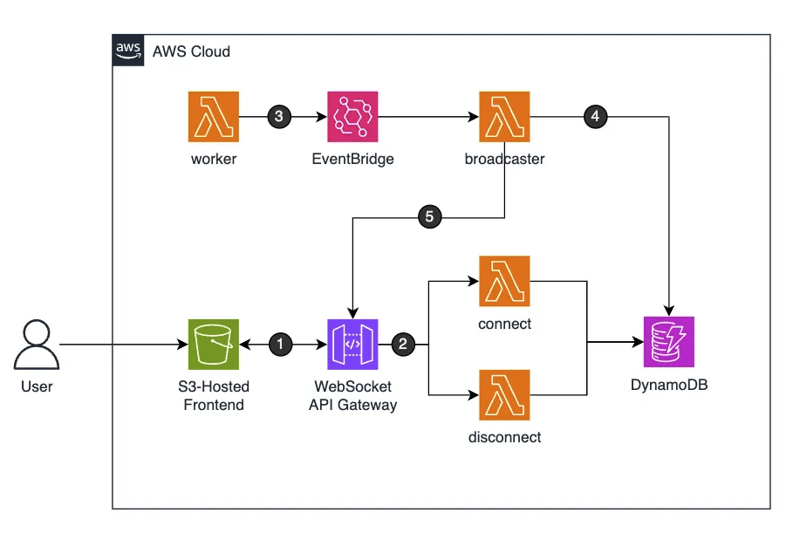
- The Frontend establishes a WebSocket connection with the API Gateway.
- API Gateway handles the connect and disconnect routes, invoking Lambda functions to store active connection IDs in DynamoDB.
- The Worker lambda simulates some work, producing start and finish events to EventBridge as the code executes. For this example, the Worker is triggered manually via a script. On normal use, this would be the actual lambdas you want to monitor.
- The Broadcaster Lambda listens for events from EventBridge, retrieves all active connection IDs from DynamoDB, and processes the event.
- The Broadcaster Lambda will then send the event details to the API Gateway, which will relay the messages to all connected WebSocket clients on the frontend.
The frontend itself is a single static HTML web page, deployed on an S3 bucket. The connection from the frontend to the API happens with the browser’s native WebSocket client.
The Worker Lambdas are the actual functions that you want to be monitoring, for example, the ones running batch jobs. For this example, though, they are functions that just start up, sleep for a random amount of time, and then stop. And they are manually triggered in batches via a script.
2. The WebSocket API
This is the central part of our service. The WebSocket API is responsible for handling the connections from the users and relaying all messages about start and finish updates from the Lambdas.
Honestly, this section was a bit weird for me at first, as my previous experience with WebSockets all came from deploying it on a server. Differently than a server deployment, we can’t simply store the connection information on the machine, either on a file, in memory, or in a memory database.
To do this in a serverless environment, each connection or disconnection to the API will need to trigger a Lambda function, which will be responsible for processing the request. As this function is also serverless, we will need a place to store our connections (state). This could be done by any type of persistent storage, but it’s very commonly done by using DynamoDB.
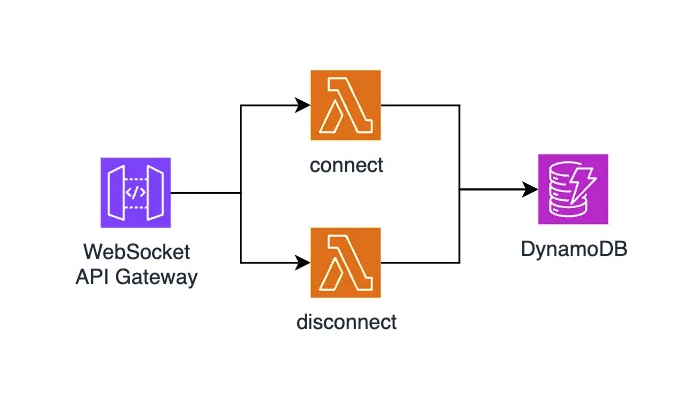
Our usage of DynamoDB here will be the simplest possible. We’re not even scratching the surface of what this service does. In short, all we do is create a table called “connections”, and store a key-value pair containing the connection ID every time a new user opens a connection, and then delete it when the user disconnects.
Now that we have a place to store our connections, the next thing we need to do is to build our Lambdas to handle them. The WebSocket API provides default routes for connecting and disconnecting, so all we need to do is point it to our Lambda functions.
This is the code for the Connect function. It gets the ID from the request event.requestContext.connectionId and stores it in DynamoDB.
import { DynamoDBClient, PutItemCommand } from "@aws-sdk/client-dynamodb";

const db = new DynamoDBClient({});
const TABLE_NAME = process.env.TABLE_NAME;

export async function handler(event) {
    console.log("Connected:", event.requestContext.connectionId);

    try {
        await db.send(new PutItemCommand({
            TableName: TABLE_NAME,
            Item: { connection_id: { S: event.requestContext.connectionId } }
        }));

        return { statusCode: 200, body: "Connected" };
    } catch (err) {
        console.error("Error:", err);
        return { statusCode: 500, body: "Connection failed" };
    }
}
With this done, we can test if it’s all working properly via the terminal:
- Get the WebSocket URL from our API:
wss://random-string.execute-api.eu-central-1.amazonaws.com/production/ - Use any WebSocket client, like wscat, to connect to it:
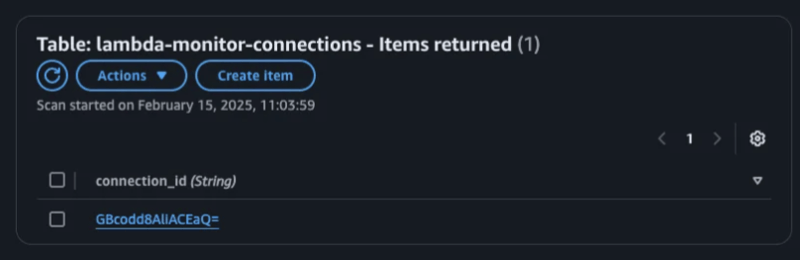
wscat -c [URL] - Check the table items in DynamoDB. The connection should show up whenever we connect, and be deleted whenever we disconnect.
If the fact that we could just copy the API URL and connect to it from any terminal window feels wrong to you, then you’re right. Our API has no authentication process, and this is what we will explore next.
2.1 Security Concerns
The easy way to add authentication into our WebSocket would be with the default “API Key Source”. Unfortunately, AWS only allows you to do this via the request header, which would not work for us because the browser’s native WebSocket client doesn’t provide header options.
If we were connecting to the API Gateway from a Node server, then auth via headers would be possible. Another route we could take is to add a Lambda Request Authorizer, for this, we would check for a specified query parameter in the Connect lambda before continuing with the request.
I chose the easy route of not doing anything. I don’t plan on leaving this monitoring up for long, as I would be deploying/destroying the code via the CDK every time I want to monitor something. If your goal is to deploy this to have it constantly running, you would need to add one of the methods above to protect who can connect to your API.
3. Event Structure
Now that we have our API Gateway ready, we need to figure out how our Worker lambda will communicate its status update so that we can relay these messages to the frontend. This will be done using EventBridge, where each update from our Lambdas will be sent to an event bus, and then we will match these events using rules. The events that match our rule will be sent to a target, which is our Broadcaster Lambda.

This might sound a bit confusing if you’ve never used EventBridge before, so let's simplify some terms and then work with an example. Here is what was created in EventBridge:
-
Event Bus: We created an event bus called
lambda-events. You can think of this as a channel that our Worker lambdas can send messages into. - Event Rule: We also created a rule, which is a structure that will be matched against every message sent on the bus. If it matches, the event is sent to the Target.
- Rule Target: In our case, this is another Lambda function, which will receive a copy of the event to act on.
Whenever our Worker Lambda starts or finishes running it sends an event like this to the event bus:
{
  Source: "worker-lambda",
  DetailType: "status-update",
  EventBusName: "lambda-events",
  // An object with metadata like "start", "finish", and timestamps.
  Detail: {...}
}
Although you can go crazy with how you add patterns and operators to your rules, the one we need is very simple and looks like this:
{
  "source": ["worker-lambda"],
  "detail-type": ["status-update"]
}
Now, every time that an event with a matching source and detail-type is published, our event will be relayed to our target, which is the Broadcaster Lambda.
3.1 Broadcasting Events
The last remaining piece of our serverless architecture is the Broadcaster Lambda, which will be responsible for relaying the events to all users connected to the Websockets API. This is how this function works:
- Receives the event in the same structure as we saw above.
- Queries DynamoDB to fetch all currently connected users.
- Loops over them, sending the event details to each connection via the API Gateway.
Here is a simplified version of the code used for the Broadcaster Lambda:
import { DynamoDBClient, ScanCommand } from "@aws-sdk/client-dynamodb";
import { ApiGatewayManagementApiClient, PostToConnectionCommand } from "@aws-sdk/client-apigatewaymanagementapi";

const APIGW_ENDPOINT = process.env.APIGW_ENDPOINT;
const TABLE_NAME = process.env.TABLE_NAME;

const dynamoClient = new DynamoDBClient({});
const apigwClient = new ApiGatewayManagementApiClient({ endpoint: APIGW_ENDPOINT });

export async function handler(event) {
  const message = event.detail;

  const connectionData = await dynamoClient.send(new ScanCommand({ TableName: TABLE_NAME }));

  const dataToSend = JSON.stringify({
    timestamp: new Date().toISOString(),
    eventDetail: message
  });

  const postCalls = (connectionData.Items || []).map(item => {
    const connectionId = item.connection_id.S;
    return apigwClient.send(new PostToConnectionCommand({
      ConnectionId: connectionId,
      Data: dataToSend,
    }));
  });

  await Promise.all(postCalls);

  return { statusCode: 200, body: "Broadcast completed." };
}
You can check the full code in the GitHub repo.
One thing that you should notice is that the Broadcaster doesn't actually use a WebSocket connection. We send the events through the AWS SDK, but when we connect to it to start the client, we use the HTTP URL.
4. The Frontend Dashboard
This part is quite simple, just requiring some Javascript logic that will update some HTML elements.
- We create an empty object.
- Every new event from a lambda comes with a unique ID for that lambda, so if we haven’t seen that lambda yet, we add a new element to the screen.
- If we have seen it before, we update it to the latest status.
- We set the CSS classes according to the status so it changes color. Here is a simplified version of the code for the update logic.
Again, you can see the full code on GitHub.
const lambdaInstances = {};

// Assumes an existing WS connection
socket.onmessage = (event) => {
    const data = JSON.parse(event.data);
    processLambdaEvent(data.eventDetail);
};

function processLambdaEvent(eventDetail) {
    const id = eventDetail.lambda_instance_id;
    const { status, timestamp } = eventDetail;

    if (!lambdaInstances[id]) {
        // New instance: add it to the UI
        lambdaInstances[id] = {
            status: status,
            lastUpdated: timestamp,
            element: addLambdaElement(id, status)
        };
    } else if (timestamp > lambdaInstances[id].lastUpdated) {
        // Update instance if the event is newer
        lambdaInstances[id].status = status;
        lambdaInstances[id].lastUpdated = timestamp;
        updateLambdaElement(lambdaInstances[id].element, status);
    }
}

function addLambdaElement(instanceId, status) {
    const container = document.getElementById("lambda-container");
    const div = document.createElement("div");
    div.id = instanceId;
    div.className = `lambda-box status-${status}`;
    // Shorten the id for display
    div.innerText = instanceId.substring(0, 6);
    container.appendChild(div);
    return div;
}

function updateLambdaElement(element, status) {
    element.className = `lambda-box status-${status}`;
}
5. Running it Yourself
Monitoring your own Lambdas should be pretty simple, you can follow the instructions in the repo’s (README)[https://github.com/mtrentz/aws-lambda-monitor], but here is a summary of how it works:
- Have the AWS CLI and CDK configured
- Clone the repo and run the
cdk deploy& the post-deployment script to configure the S3 Website - Go into the S3 website, connect to the WebSocket, and then run the other script provided to trigger a few mock worker Lambas
If that works for you and you are able to see the updates in real-time, then you’re good to go to make this run on your own lambdas. So now let’s talk about how you do that.
First, notice that the Worker Lambda wraps its handler with a withMonitoring higher order function:
import { withMonitoring } from "./monitoring.mjs";

async function actualHandler(event, context) {
    console.log(`Lambda ${context.awsRequestId} is processing...`);

    // Simulate some work (e.g., sleeping for a random duration)
    const randomSleep = Math.floor(Math.random() * 10) + 1;
    await new Promise((resolve) => setTimeout(resolve, randomSleep * 1000));

    return {
        statusCode: 200,
        body: "Work completed!",
    };
}

// Export the handler wrapped with monitoring
//                     vvvvvvvvvvvvvvv
export const handler = withMonitoring(actualHandler);
This comes from the monitoring.mjs file that you can simply copy and paste into your existing lambda code, import it on your main file, and wrap the handler in the same way it’s done in the example above. All it’s going to do is send start and finish events as your Lambda runs.
import { EventBridgeClient, PutEventsCommand } from "@aws-sdk/client-eventbridge";
import { randomUUID } from "crypto";

const EVENT_BUS_NAME = process.env.EVENT_BUS_NAME;
const EVENT_SOURCE = process.env.EVENT_SOURCE;

const eventbridge = new EventBridgeClient({});

// Generate a unique identifier for this Lambda instance (one per cold start)
const LAMBDA_INSTANCE_ID = randomUUID();

/**
 * Sends a status event to EventBridge.
 * @param {string} status - e.g. "start", "finished"
 * @param {string} message - Descriptive message.
 * @param {object} context - Lambda context (to get the request ID, etc.).
 */
export async function sendEvent(status, message, context) {
    const eventDetail = {
        lambda_instance_id: LAMBDA_INSTANCE_ID, // Unique ID for this Lambda instance
        request_id: context.awsRequestId, // Request ID (unique per invocation)
        status,
        message,
        timestamp: Math.floor(Date.now() / 1000),
    };

    const command = new PutEventsCommand({
        Entries: [
            {
                Source: EVENT_SOURCE,
                DetailType: "status-update",
                Detail: JSON.stringify(eventDetail),
                EventBusName: EVENT_BUS_NAME,
            },
        ],
    });

    await eventbridge.send(command);
}

/**
 * Higher-order function (decorator) that wraps a Lambda handler
 * to send start and finished events.
 * @param {Function} handler - The actual Lambda handler.
 * @returns {Function} A wrapped handler that sends events before and after execution.
 */
export function withMonitoring(handler) {
    return async (event, context) => {
        // Send the start event
        await sendEvent("start", "Lambda handler started", context);
        try {
            // Run the actual Lambda handler
            const result = await handler(event, context);
            // Send the finished event
            await sendEvent("finished", "Lambda handler finished", context);
            return result;
        } catch (error) {
            throw error;
        }
    };
}
The last thing you will need is to set the following Environment Variables into your own Lambda:
EVENT_BUS_NAME = 'lambda-monitor-events'EVENT_SOURCE = 'lambda-monitor-lambda'
6. Conclusion
This was a very fun project to build and I feel that I learned so much about designing serverless applications. It’s definitely a different way of doing things than using a monorepo on a single server, as I was used to doing.
The result of it it’s quite useful too, letting both me and you easily run it on demand to monitor lambda batch executions. To finish it off, let’s recap everything we saw:
- We built a system that lets you visualize Lambda execution times and statuses in real-time on a simple webpage.
- We explored how to work with a Websocket API Gateway, and the challenges of keeping state on a serverless application.
- We also learned about EventBridge and its components. This is incredibly powerful to connect many AWS Services.
- This project can be easily deployed by yourself to monitor your own Lambdas by following the README.
Hope you enjoyed this reading and will try the project for yourself! Do you think this could be useful for you? What do you think is missing? Feel free to comment here or on GitHub.
All images by the author unless stated otherwise

Top comments (0)