One thing that we haven't done is some benchmarking. For this I though I'd start with a simple perceptron and scale up the size of the tensors.
import { Tensor } from "../src/js/tensor.js";
import { CUDATensor } from "../src/js/cuda-tensor.js";
import { WGPUTensor } from "../src/js/wgpu-tensor.js";
import { range } from "../src/js/tensor-utils.js";

for(let i = 1; i < 12; i++){
    const size = 2 ** i;
    Deno.bench(`CPU Perceptron ${size}x${size}`, { group: `Perceptron ${size}x${size}`, baseline: true }, () => {
        const x = new Tensor({ shape: [size, size], values: [...range(size * size)], label: "x" });
        const w = new Tensor({ shape: [size, size], values: [...range(size * size)], label: "w" });
        const b = new Tensor({ shape: [size, 1], values:[...range(size)], label: "b" });

        const xw = x.mul(w);
        const i = xw.sum({ dimensionToReduce: 0 });
        const t = i.add(b);
        const o = t.tanh();
    });

    Deno.bench(`CUDA Perceptron ${size}x${size}`, { group: `Perceptron ${size}x${size}` }, () => {
        const x = new CUDATensor({ shape: [size, size], values: [...range(size * size)], label: "x" });
        const w = new CUDATensor({ shape: [size, size], values: [...range(size * size)], label: "w" });
        const b = new CUDATensor({ shape: [size, 1], values: [...range(size)], label: "b" });

        const xw = x.mul(w);
        const i = xw.sum({ dimensionToReduce: 0 });
        const t = i.add(b);
        const o = t.tanh();
    });
    const adapter = await navigator.gpu.requestAdapter();
    const device = await adapter.requestDevice();
    Deno.bench(`WGPU Perceptron ${size}x${size}`, { group: `Perceptron ${size}x${size}` }, async (bench) => {
        const x = new WGPUTensor({ shape: [size, size], values: [...range(size * size)], label: "x", device });
        const w = new WGPUTensor({ shape: [size, size], values: [...range(size * size)], label: "w", device });
        const b = new WGPUTensor({ shape: [size, 1], values: [...range(size)], label: "b", device });

        const xw = await x.mul(w);
        const i = await xw.sum({ dimensionToReduce: 0 });
        const t = await i.add(b);
        const o = await t.tanh();
    });
}
The results were pretty surprising. I would have expected the CPU to do well up until a point which happens to be around 1024x1024. At this point WebGPU takes over. At none of the measurements did the CUDA version ever perform better which I did not expect. I would have thought calling things directly via FFI would have a lot less overhead as WebGPU has to do a lot of accounting, bounds checking etc. One possible reason might be something to due with the kernel being warmed up and maybe there's something there? Or maybe the way workgroups are setup? I don't tear down the device between runs mainly because if I do then Deno crashes so perhaps it's not apples to apples.
What can we optimize?
For the CPU version not a huge amount. The most obvious thing to we would be to use more threads via web workers. If we have a shared array buffer then we can write to it the same way we do on the GPU with each thread assigned to a segment of memory, like maybe indices that are modulo the number of threads. I'm not super interested in pursuing this at the moment but it's an idea. The CUDA version feels like it could be faster, at least I'm surprised that with less overhead it doesn't outperform WebGPU.
When we sit down to make something faster I think the best way to approach this is to approach with an intent because there's so many ways we can go with this and we can choose different things to go after. What I want to to figure out why the CUDA version seems to defy expectations and maybe improve it. The first step is we're going to have to profile what is going on.
Profiling
If we want to start profiling it's not exactly obvious how to go about it. The simplest way at least with Deno or any runtime that support the Chrome dev tool protocol is probably via Chrome itself. The first thing is to make an example of some aspect of the application, in this case I'm reusing the perceptron example and then I need to run it in a loop. This seems weird but given how the profiler works you can't just set a breakpoint and bring it up, so we want it continually running.
//perceptron.cuda.prof.js
import { CUDATensor } from "../src/js/cuda-tensor.js";
import { range } from "../src/js/tensor-utils.js";

const size = 1000;

while(true){
    const x = new CUDATensor({ shape: [size, size], values: [...range(size * size)], label: "x" });
    const w = new CUDATensor({ shape: [size, size], values: [...range(size * size)], label: "w" });
    const b = new CUDATensor({ shape: [size, 1], values: [...range(size)], label: "b" });
    const xw = x.mul(w);
    const i = xw.sum({ dimensionToReduce: 0 });
    const t = i.add(b);
}
Next we need to run it such that we can attach to the process with the Chrome debugger.
deno run --inspect-brk --allow-ffi ./prof/perceptron.cuda.prof.js
The --inspect-brk is probably familiar if you run using the VSCode debugger but in this case we just run it from the command line. Then we need to open Chrome and open a dev tool window.
![]()
That little hexagon should be green if Chrome detects a running instance of node/deno etc. If you click it a new window will open with the scripts panel open and it should catch on the initial breakpoint (the -brk part of --inspect-brk) which is somewhere after most of the code has loaded. In the bottom panel click on the performance tab. Next we need to select the VM which should be the path to the script you are trying to run.

From here we can press the record button and take a few seconds worth of data before stopping. Chrome will then present us with a flamegraph (you can save these files and load them later too).
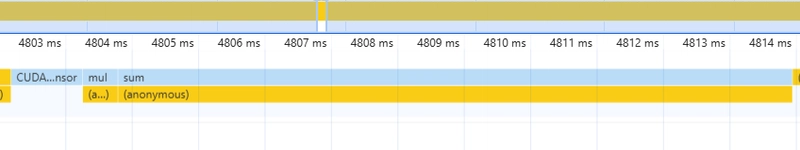
Looking into a slice of this we can see we create a tensor, call mul and then call sum. These in turn have some anonymous functions underneath them which is probably where the delegation to the CUDA kernel happens. What we can see is that most of the time is spent in the sum kernel. For comparison let's look at the CPU kernel which is a sort of baseline.
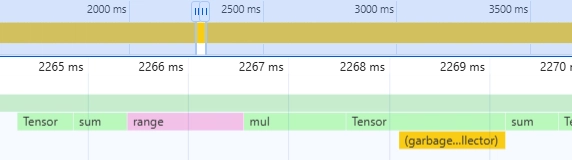
There's some more things going on here but we can see it's similar. However, much less time is spent in the sum part of the code. It will vary between each run but just with some visual inspection (I didn't parse the .cpuprofile).
| Version | Time spent in sum | Time spent in mul |
|---|---|---|
| CUDA | ~380ms | ~5ms |
| JS (CPU) | ~60ms | ~2.5 - 4ms |
| WGPU | ~2.5ms | ~10ms |
What we can see is that for 1000x1000 tensors, CPU is still doing better and much of this is due to how much faster the sum operation is. The mul isn't too far off and probably comes down to memory copies. It's very surprising to be then that the WGPU sum kernel is not just faster, it's faster than multiplying in general so we must be doing something interesting there.
Unfortunately, from here I didn't find a good way to profile deeper into the native code itself. I probably could have tried to run the kernel from C code using nsight but that didn't seem very appealing at least at this point. But because we know that the WebGPU code is much more efficient perhaps we can understand why that might be. The biggest thing was that we had to change the algorithm to use a memory arena because we had no way to dynamically allocate. Now, in general we know that allocation tends to be slow so that immediately jumps out as a possible culprit. So what I tried is to port the WebGPU code back to CUDA so that we're only using static allocations.
float *sum_op(const int *shape, const int shapeSize, const int dimToReduce, const float *values)
{
    int BLOCK_SIZE = 32;

    int size = 1;
    for (int i = 0; i < shapeSize; i++)
    {
        size *= shape[i];
    }
    int outSize = size / shape[dimToReduce];

    int GRID_SIZE = (int)ceil(size / (float)BLOCK_SIZE);

    float *output = new float[outSize];

    float *values_d;
    float *output_d;
    int *shape_d;
    char*mem_d;

    cudaMalloc((void **)&values_d, size * sizeof(float));
    cudaMalloc((void **)&output_d, outSize * sizeof(float));
    cudaMalloc((void **)&shape_d, shapeSize * sizeof(int));

    // memory areana
    int threadMemSize = ((shapeSize * 4) - 2) * 4;
    cudaMalloc((void **)&mem_d, threadMemSize * outSize);

    cudaMemcpy(values_d, values, size * sizeof(float), cudaMemcpyHostToDevice);
    cudaMemcpy(shape_d, shape, shapeSize * sizeof(int), cudaMemcpyHostToDevice);

    sumKernel<<<GRID_SIZE, BLOCK_SIZE>>>(shape_d, shapeSize, dimToReduce, values_d, output_d, mem_d);
    cudaDeviceSynchronize();
    cudaError_t err = cudaGetLastError();
    if (err != cudaSuccess)
    {
        printf("CUDA error: %s\n", cudaGetErrorString(err));
    }

    cudaMemcpy(output, output_d, outSize * sizeof(float), cudaMemcpyDeviceToHost);

    cudaFree(values_d);
    cudaFree(output_d);
    cudaFree(shape_d);
    cudaFree(mem_d);

    return output;
}

void sumBackprop_op(const int *shape, const int shapeSize, const int dimToReduce, float *grad, const float *gradResult)
{
    int BLOCK_SIZE = 32;

    int size = 1;
    for (int i = 0; i < shapeSize; i++)
    {
        size *= shape[i];
    }
    int outSize = size / shape[dimToReduce];

    int GRID_SIZE = (int)ceil(size / (float)BLOCK_SIZE);

    float *grad_d;
    float *gradResult_d;
    int *shape_d;
    char *mem_d;

    cudaMalloc((void **)&grad_d, size * sizeof(float));
    cudaMalloc((void **)&gradResult_d, size * sizeof(float));
    cudaMalloc((void **)&shape_d, shapeSize * sizeof(int));

    // memory areana
    int threadMemSize = ((shapeSize * 4) - 2) * 4;
    cudaMalloc((void **)&mem_d, threadMemSize * outSize);

    cudaMemcpy(grad_d, grad, size * sizeof(float), cudaMemcpyHostToDevice);
    cudaMemcpy(gradResult_d, gradResult, outSize * sizeof(float), cudaMemcpyHostToDevice);
    cudaMemcpy(shape_d, shape, shapeSize * sizeof(int), cudaMemcpyHostToDevice);

    sumBackpropKernel<<<GRID_SIZE, BLOCK_SIZE>>>(shape_d, shapeSize, dimToReduce, grad_d, gradResult_d, mem_d);
    cudaDeviceSynchronize();
    cudaError_t err = cudaGetLastError();
    if (err != cudaSuccess)
    {
        printf("CUDA error: %s\n", cudaGetErrorString(err));
    }

    cudaMemcpy(grad, grad_d, size * sizeof(float), cudaMemcpyDeviceToHost);

    cudaFree(grad_d);
    cudaFree(gradResult_d);
    cudaFree(shape_d);
    cudaFree(mem_d);
}

__device__ void insertAtIndex(const int sourcePtr, const int length, const int destinationPtr, const int indexToInsert, const int value, char *mem)
{
    int sourceIndex = 0;
    int destinationIndex = 0;

    while (destinationIndex < length + 1)
    {
        if (destinationIndex != indexToInsert)
        {
            mem[destinationPtr + destinationIndex] = mem[sourcePtr + sourceIndex];
            sourceIndex++;
            destinationIndex++;
        }
        else
        {
            mem[destinationPtr + destinationIndex] = value;
            destinationIndex++;
        }
    }
}

__device__ void removeAtIndex(const int sourcePtr, const int length, const int destinationPtr, const int indexToRemove, char *mem)
{
    int sourceIndex = 0;
    int destinationIndex = 0;

    while (destinationIndex < length - 1)
    {
        if (sourceIndex != indexToRemove)
        {
            mem[destinationPtr + destinationIndex] = mem[sourcePtr + sourceIndex];
            sourceIndex++;
            destinationIndex++;
        }
        else
        {
            sourceIndex++;
        }
    }
}

__device__ void getDimensionalIndices(int flatIndex, const int shapePtr, const int shapeSize, const int destinationPtr, char *mem)
{
    int currentIndex = flatIndex;

    for (int i = 0; i < shapeSize; i++)
    {
        mem[destinationPtr + i] = currentIndex % mem[shapePtr + i];
        currentIndex = currentIndex / mem[shapePtr + i];
    }
}

__device__ int getFlatIndex(const int dimensionalIndexPtr, const int shapePtr, const int shapeSize, char *mem)
{
    int index = 0;
    for (int i = 0; i < shapeSize; i++)
    {
        index *= mem[shapePtr + shapeSize - 1 - i];
        index += mem[dimensionalIndexPtr + shapeSize - 1 - i];
    }
    return index;
}

__global__ void sumKernel(const int *shape, const int shapeSize, const int dimToReduce, const float *values, float *output, char *mem)
{
    int idx = blockIdx.x * blockDim.x + threadIdx.x;

    int newSize = 1;
    for (int j = 0; j < shapeSize; j++)
    {
        if (j != dimToReduce)
        {
            newSize *= shape[j];
        }
    }
    if (idx < newSize)
    {
        size_t basePtr = idx * ((shapeSize * 4) - 2); //manual calc :/
        size_t memPtr = basePtr;
        size_t shapePtr = basePtr;

        for (int i = 0; i < shapeSize; i++)
        {
            mem[memPtr] = shape[i];
            memPtr++;
        }

        size_t newShapePtr = memPtr;
        removeAtIndex(shapePtr, shapeSize, newShapePtr, dimToReduce, mem);
        memPtr += shapeSize - 1;

        size_t partialDimIndexPtr = memPtr;
        getDimensionalIndices(idx, newShapePtr, shapeSize - 1, partialDimIndexPtr, mem);
        memPtr += shapeSize - 1;

        for (int i = 0; i < shape[dimToReduce]; i++)
        {
            size_t dimIndexPtr = memPtr;
            insertAtIndex(partialDimIndexPtr, shapeSize - 1, dimIndexPtr, dimToReduce, i, mem);

            size_t flatIdx = getFlatIndex(dimIndexPtr, shapePtr, shapeSize, mem);
            output[idx] += values[flatIdx];
        }
    }
}

__global__ void sumBackpropKernel(const int *shape, const int shapeSize, const int dimToReduce, float *grad, const float *gradResult, char* mem)
{
    int idx = blockIdx.x * blockDim.x + threadIdx.x;

    int inSize = 1;
    for (int j = 0; j < shapeSize; j++)
    {
        inSize *= shape[j];
    }

    if (idx < inSize)
    {
        size_t basePtr = idx * ((shapeSize * 4) - 2); //manual calc :/
        size_t memPtr = basePtr;
        size_t shapePtr = basePtr;

        for(int i = 0; i < shapeSize; i++){
            mem[memPtr] = shape[i];
            memPtr++;
        }

        size_t outShapePtr = memPtr;
        removeAtIndex(shapePtr, shapeSize, outShapePtr, dimToReduce, mem);
        memPtr += shapeSize - 1;

        size_t inDimIndexPtr = memPtr;
        getDimensionalIndices(idx, shapePtr, shapeSize, inDimIndexPtr, mem);
        memPtr += shapeSize;

        size_t outDimIndexPtr = memPtr;
        removeAtIndex(inDimIndexPtr, shapeSize, outDimIndexPtr, dimToReduce, mem);
        memPtr += shapeSize - 1;


        size_t outputFlatIdx = getFlatIndex(outDimIndexPtr, outShapePtr, shapeSize - 1, mem);

        grad[idx] += gradResult[outputFlatIdx];
    }
}
There's a few changes but the overall algorithm is exactly the same. Instead we do what we did for WebGPU and allocate a big block of memory where all the calculations for happen for all thread. Each thread calculates a base pointer for it's portion of the memory and then does bump allocation for the intermediate arrays. Since we know the algorithm up-front we know exactly how much space to allocate (if we change the algorithm we'd need to recalculate). Since I'm not really an expert on C/CUDA I'm sure there are better ways to write this code but this was the most straight-forward way to port it. I'm sure there are also more tricks that can be used here.
Making these changes on my machine puts the CUDA version back at the top for big matrices. It's not hugely faster than WebGPU but it definitely falls where I think as CUDA should be more efficient overall.
We now have a reasonably efficient CUDA kernel that we can use by default (if on Window and Nvidia GPU).

Top comments (0)