
Data Science is the one of the most popular fields across the world. In Data science, the most useful concept is Statistics.
What Are Statistics?
Statistics provides the means to analysis of data and summarize to numeric data. It is a branch of applied mathematics that involves the collecting, description, analysis, interpretation, and presentation of data. The mathematical theories behind statistics rely heavily on differential and integral calculus, linear algebra, and probability theory.
Types of Statistics
Statistics have majorly categorized into two types:
- Descriptive statistics
- Inferential statistics
1. Descriptive Statistics.
Descriptive statistics is summarized in the data at certain number like mean, median etc. to make the understanding of the data easier.
Descriptive statistics are also divided into categories.
- Measure of frequency.
- Measure of dispersion.
- Measure of central tendency.
- Measure of position.
2. Inferential Statistics.
Inferential statistics is used to interpret the meaning of Descriptive Statistics.
In these article, I will be sharing the most commonly used statistical concepts in data science.
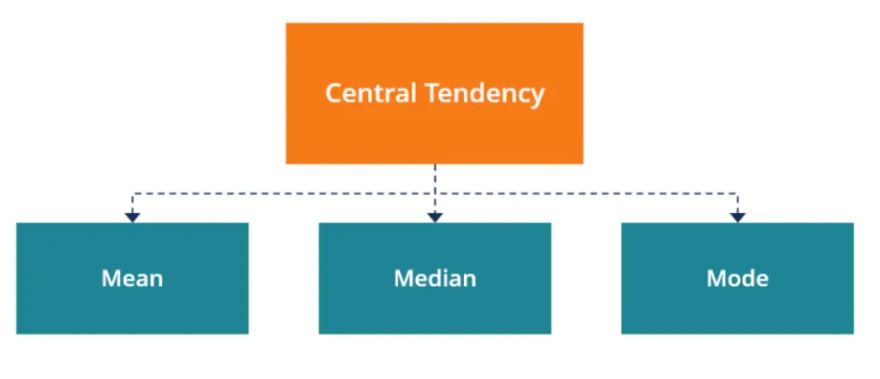
1. Measures Of Central Tendency
In statistics, central tendency is a value of probability distributions. It is also called a center or location of the distribution.
In other words, central of tendency give the summary of the data as an output of one value.
Measure of central tendency is further categorized into three types : mean, median, mode
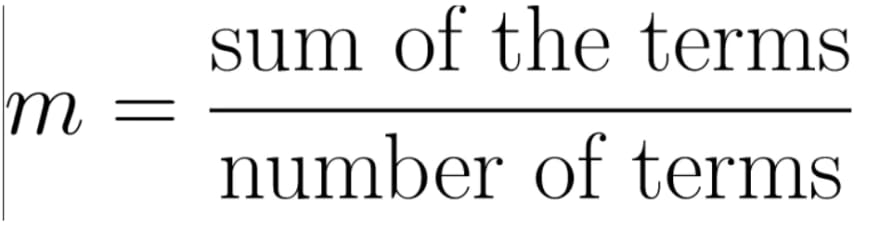
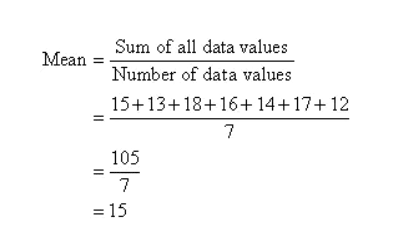
Mean
Mean is defined as the ratio of the sum of all the observations in the data to the total number of observations. This is also known as average. Thus, mean is a number around which the entire data set is spread
Example:
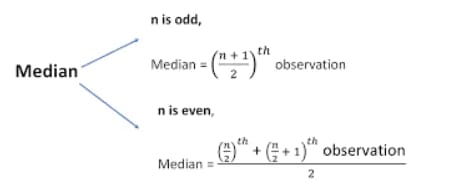
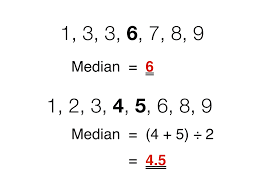
Median
The median of a finite list of numbers is the "middle" number, when those numbers are listed in order from smallest to greatest.
- If the number of observations is odd number when arranged in ascending or descending order. The middle number, which is median.
- If the number of observations are even, median is given by the mean of the two middle observation in the sorted form
Example:
Mode
Mode is the most frequently occurred value in the dataset.
- If there is only one number that appears the maximum number of times, the data has one mode, and is called Uni-modal.
- If there are two numbers that appear the maximum number of times, the data has two modes, and is called Bi-modal.
- If there are more than two numbers that appear the maximum number of times, the data has more than two modes, and is called Multi-modal.
Example:

Normal Distribution
Normal (Gaussian) distribution is a probability distribution function that looks like a bell.
Normal distribution is a function that shows the probability of the outcome of an experiment
Example: Let's say in a class contains 10 students having different height's. Some are shorter, taller and most of them have same average. Using normal distribution for these example

3. Population and sample
Population and sample are the most commonly used. Sample is the subset of the population. Beside of population and sample, we also have to know two terms, population mean and sample mean.
Example: Let's say we have to find the average age of the population in a particular city containing more than 1,000,000 population. It's so hard, and calculated the average by visiting each one of them. To avoid this situation, we will be using sample, where we will be collecting information of 10% population in that city. The average going to be our age. Which is estimated as average of our population.
4. Variance and Standard deviation
Variance is a measure of the variation among values. It is calculated by adding up the squared differences of each value and the mean, and then dividing the sum by the number of samples.

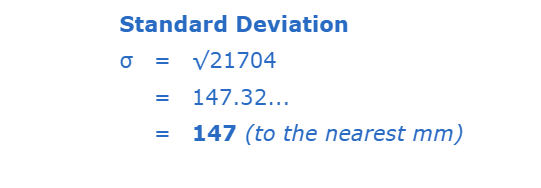
Example: My friends wanted to calculate their pets variance and standard deviation, where their height are (600, 470, 170, 430, 300) in mm.
Lets us first calculate the mean.

Now calculated the variance

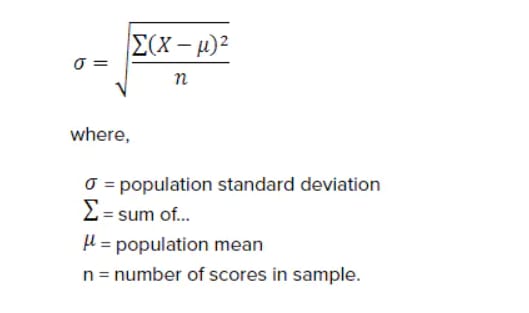
Standard deviation is the square root of variance.
now calculate the standard deviation for the above example
Note: Mean, median, mode, variance, and standard deviation are basic descriptive statistics that help to explain a variable
5. Bayes' Theorem
The bayes theorem is used to calculate the conditional probability, which is nothing but the probability of an event occurring based on prior knowledge of conditions that might be related to the event.
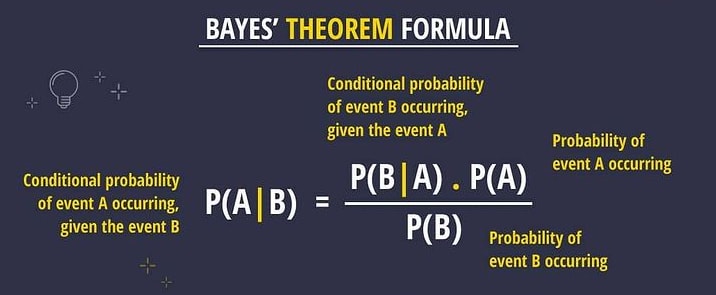
Terminologies of the Bayesian Theorem
P(A) - Prior Probability
P(B) - Marginalization
P(A|B) - Posterior Probability
P(B|A) - Likelihood
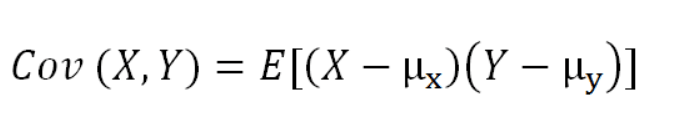
6. Covariance and correlation
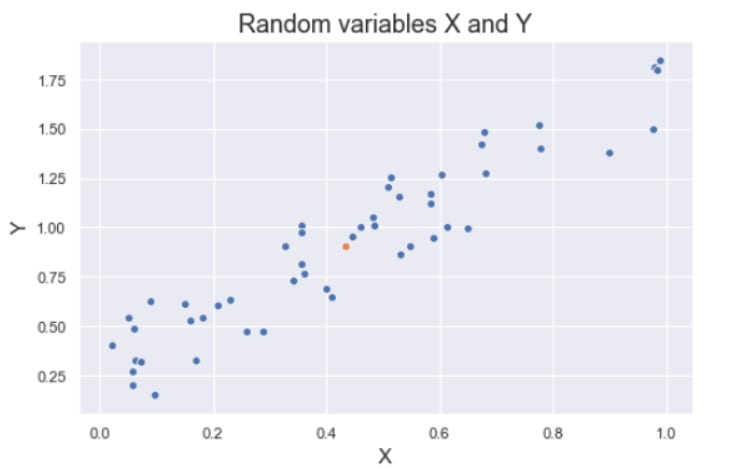
Covariance is a quantitative measure that represents how much the variations of two variables match each other. To be more specific, covariance compares two variables in terms of the deviations from their mean (or expected) value. The figure below shows some values of the random variables X and Y. The orange dot represents the mean of these variables. The values change similarly with respect to the mean value of the variables. Thus, there is positive covariance between X and Y.
The formula for covariance of two random variables
Note: The covariance of a variable with itself is the variance of that variable. Correlation is a normalization of covariance by the standard deviation of each variable.

where σ is the standard deviation.
This normalization cancels out the units and the correlation value is always between 0 and 1. Please note that this is the absolute value. In case of a negative correlation between two variables, the correlation is between 0 and -1. If we are comparing the relationship among three or more variables, it is better to use correlation because the value ranges or unit may cause false assumptions.
7. Central Limit Theorem
The Central Limit Theorem is the basis for a lot of statistics. It is a simple concept and easily understand
Whenever a distribution of a random variables are unknown, normal distribution is used(mostly). According to central limit theorem, as we take more samples from the distribution, the sample averages will tend towards a normal distribution (bell shaped curve) regardless of the population distribution.
Examples:
Consider, we were given a dataset. We don't know which type of distribution type is, whether it is a normal, binomial, uniform etc. What we want to do is collect some random samples from the dataset and calculate its mean.
No matter what the distribution of the dataset. The mean of all the samples is going to be a normal distribution. The more sample we collect and calculate the mean, the more we get closer to the normal distribution.

8. P-value
A p-value is a measure of the probability that an observed difference could have occurred just by random chance.
Note:The lower the p-value, the greater the statistical significance of the observed difference.
A p-value doesn’t prove anything. It’s simply a way to use
surprise as a basis for making a reasonable decision - Cassie
Kozyrkov
9. Expected value of random variables
The expected value of a random variable is the weighted average of all possible values of the variable. The weight here means the probability of the random variable taking a specific value.
The expected value is calculated differently for discrete and continuous random variables.
Discrete random variables take finitely many or countably infinitely many values. The number of rainy days in a year is a discrete random variable.
Continuous random variables take uncountably infinitely many values. For instance, the time it takes from your home to the office is a continuous random variable. Depending on how you measure it (minutes, seconds, nanoseconds, and so on), it takes uncountably infinitely many values
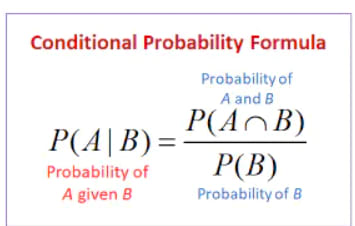
10. Conditional probability
Conditional probability is defined as the likelihood of an event or outcome occurring, based on the occurrence of a previous event or outcome. Conditional probability is calculated by multiplying the probability of the preceding event by the updated probability of the succeeding, or conditional, event.

Top comments (2)
Good primer! Thanks
Thank you @matt Curcio