
Welcome to the Process Analytics monthly news 👋.
As we remind you each month, the goal of the Process Analytics project is to rapidly display meaningful Process Analytics components in your web pages using BPMN 2.0 notation and Open Source libraries.
In March, we worked on improving the bpmn-visualization TypeScript library and the bpmnVisualizationR package 🤗. Let’s see what’s new here 👀!
bpmn-visualization TypeScript library
In March, we released 2 versions: 0.22.0 & 0.23.0.
Improvements for TypeScript projects 📃
We simplified the TypeScript integration by removing the need to install typed-mxgraph in your project.
It is now easier than ever to use bpmn-visualization in TypeScript projects 🎉.
New API 📚
It is possible to use the new API to retrieve the bpmn-visualization and mxGraph versions used at runtime: getVersion().
An example of an integration is shown below 👇.
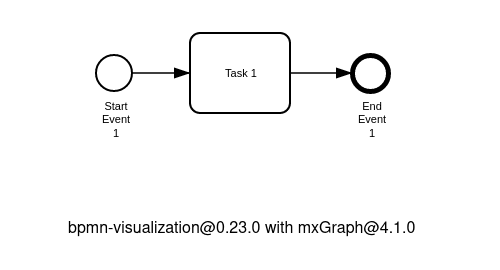
This is done with the following JavaScript code that displays the version information in the footer of the page:
// Use the new “Version” API
const version = bpmnVisualization.getVersion();

// bpmn-visualization version
const versionAsString = `bpmn-visualization@${version.lib}`;

// List all dependencies in the form of “dependency-1@version / dependency-2@version / ….”
const dependenciesAsString = [...version.dependencies].map(([name, version]) => `${name}@${version}`).join('/');

// “footer” is the html element that displays the version information
footer.innerText = `${versionAsString} with ${dependenciesAsString}`;
NOTE: This is helpful to debug projects that use a newer version of the mxGraph library which currently causes issues, like version 4.2.2.
BPMN rendering fixes ✅
☢️ The library didn't accept the coordinates of the waypoints of the edges defined in the BPMN 2.0 source. Instead, it forced the usage of orthogonal edges which had a lot of side effects.
The video below 👇 shows the behavior changes on message flows. The first part presents the rendering as it was done prior to the 0.23.0 version. The position of the message flow (and its label) sometimes changed depending on the zoom factor 😵💫. The same issue applied to overlays that were configured to be displayed at the middle of the edges. They were moved to the start or the end of the edge.
The second part of the video is done using the 0.23.0 version. The edge segments are no longer always orthogonal and the position of the element remains unchanged, regardless of the zoom factor. 🥳

Have a look at the release notes of the 0.23.0 version to get the complete list of issues that are fixed by removing the 'always use orthogonal edges' configuration.
Documentation improvement 🎁
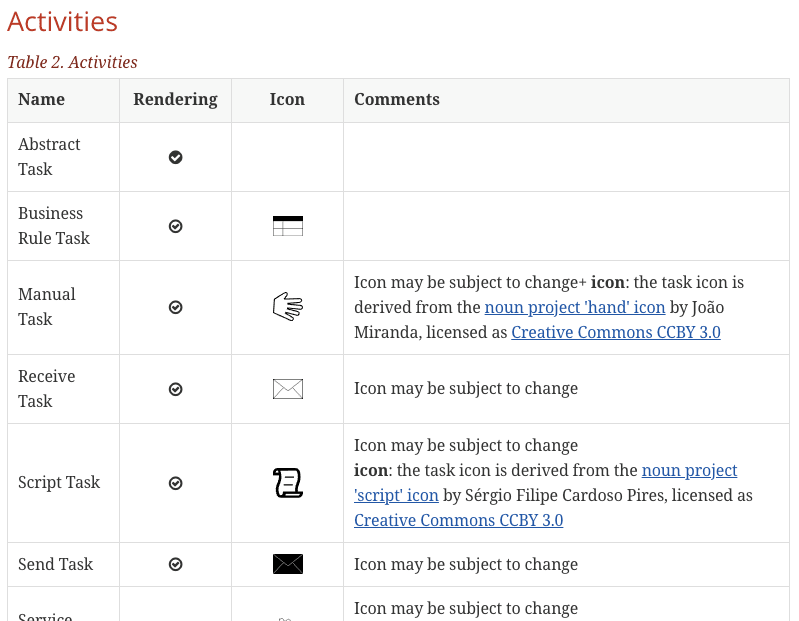
The icons used in the library are now available in SVG format in the docs/users/images/icons folder. Feel free to reuse the icons in your application.
The user documentation has also been updated to display the icons.
Demo improvement ✨
The layout of the demo has been improved for mobile devices.
The demo also displays the current versions of bpmn-visualization and of the mxGraph library in the footer.

bpmnVisualizationR package
In March, we released 1 version: 0.1.2.
The major change is the upgrade of the bpmn-visualization TypeScript library to version 0.23.0.
That’s All Folks!
We hope you enjoyed this March project news and are looking forward to what April will bring 👋.
In the meantime, to stay on top of the latest news and releases, follow us through:
- Website: https://process-analytics.dev
- Twitter: @ProcessAnalyti1
- GitHub: https://github.com/process-analytics
Cover photo by Dustin Humes on Unsplash

Top comments (0)